
What Is Accounts Receivable Turnover? A Clear Guide
October 30, 2025
What Is Capital Expenditure? A Clear Explanation
November 1, 2025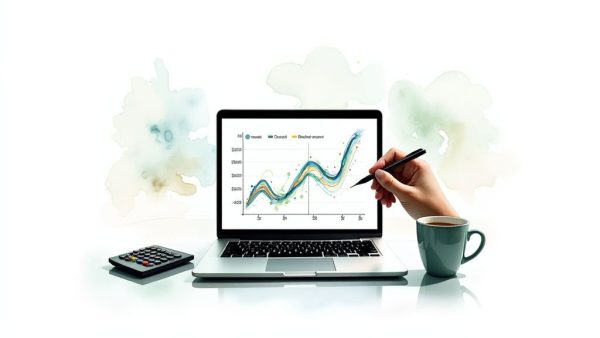
A Simple Break Even Analysis Template for NZ Businesses
A good break-even analysis template isn’t just about plugging in numbers. It’s about getting a clear, simple answer to the question: how much do I need to sell to stop losing money?
By popping in your fixed costs, your variable costs per unit, and your selling price, the template does the heavy lifting for you. It instantly calculates the exact number of units you need to move, or the total revenue you need to hit, just to cover your bases.
Why Your Business Needs to Know Its Break-Even Point
Let’s be honest, running a business in New Zealand is tough. Figuring out your break-even point isn’t just a boring accounting task; it’s like having a financial compass for your business. It tackles the most fundamental question every owner asks: ‘How much do I really need to sell just to pay all the bills?’
Knowing this one number is incredibly empowering. It gives you the confidence to make smarter decisions on everything from setting your prices to managing your expenses.
The Core Components of Your Break-Even Analysis
To find your break-even point, you only need to get your head around three key things. Think of them as the basic ingredients for your business’s financial health:
- Fixed Costs: These are the bills you have to pay every month, no matter what. Think rent for your workshop, insurance, and salaries for your permanent staff. They’re predictable and consistent.
- Variable Costs: These costs pop up only when you make a sale. For a café, this is the cost of the coffee beans, milk, and cup for every flat white you sell. No sale, no cost.
- Revenue: This one’s simple – it’s the cash you bring in from selling your products or services, based on your price per item.
For Kiwi small businesses, getting this right is crucial for survival. Given that 97% of businesses in New Zealand employ fewer than 20 people, simple tools like this are a lifesaver. They can help you avoid common traps like overtrading, especially when interest rates are high and customer demand is a bit sluggish. If you want to dive deeper, MYOB has some great insights on break-even analysis that are well worth a read.
By demystifying these numbers, you transform guesswork into a clear strategy. You’re no longer just hoping for profitability; you’re actively planning for it.
This guide, and the free template that comes with it, is designed to give you the financial clarity every Kiwi business owner deserves.
Getting Your Hands on the Free Break-Even Template
Alright, let’s get you set up with the tool that will put you back in the driver’s seat of your finances. We’ve built a simple, no-fuss break-even analysis template for you, and it’s available in both Excel and Google Sheets. The goal here is to give you a crystal-clear picture of your business’s financial health.
First things first, you’ll need to grab your own editable copy. Just click the download link for the version you prefer. If you’re a Google Sheets user, simply head to File > Make a copy and save it directly to your own Google Drive. Easy as that.
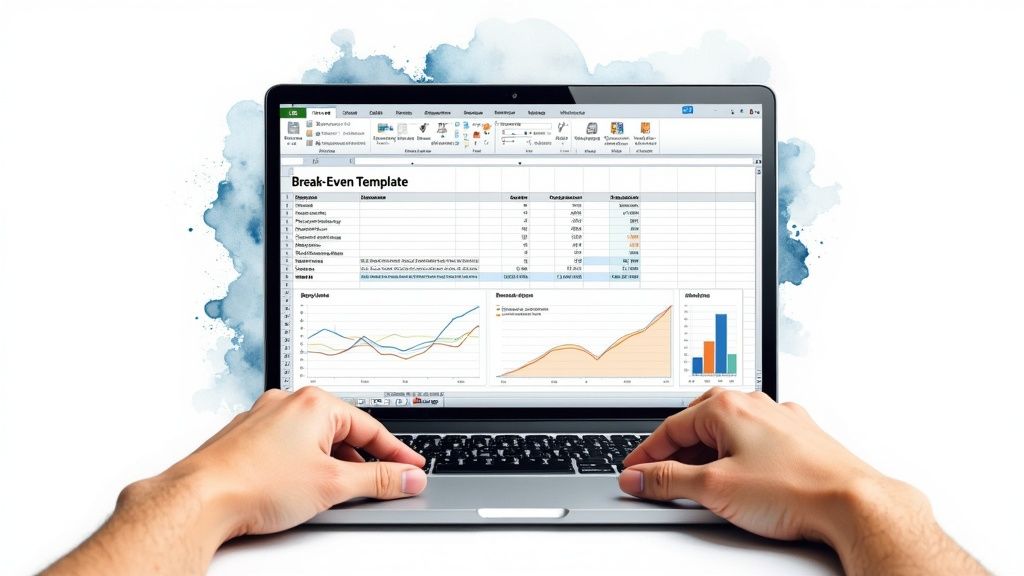
As you can see, the layout is clean and designed to get you from numbers to insights without any headaches.
A Quick Look Inside the Template
We designed this for clarity, not complexity. You’ll find it’s broken down into three main sections that seamlessly work together, turning your raw data into something you can actually use.
- The ‘Input’ Sheet: This is where the magic starts. It’s the only place you need to enter your figures—specifically, your costs and your selling price.
- The ‘Dashboard’ View: The moment you plug in your numbers, this dashboard instantly calculates and displays your results. You’ll see your break-even point in both the number of units you need to sell and the total revenue required.
- The ‘Chart’ Visualisation: For those of us who are more visual, this graph plots your path to profitability. It’s incredibly satisfying to see the exact point where your revenue line finally overtakes your total costs.
Wondering where to find all these numbers? It’s probably easier than you think. Most of the key figures, especially your costs, are waiting for you on the Profit & Loss statement inside your accounting software, like Xero.
This template is all about taking the guesswork out of your financial planning. When you see all your numbers organised in one place, you immediately understand how every cost and pricing decision affects your bottom line.
To get started, the main task is to split your expenses into two camps. If you need a refresher, our guide on the difference between fixed and variable costs breaks it down clearly.
While our template is a fantastic starting point for most businesses, property investors often need a bit more firepower for their modelling. If that’s you, you might find it useful to learn how to build a comprehensive real estate investment analysis spreadsheet to handle more complex scenarios.
And if you get stuck or just want a second pair of expert eyes on your analysis, don’t hesitate to get in touch. Here at Business Like NZ Ltd, we’re a team of affordable, down-to-earth chartered accountants supporting Auckland businesses and property investors with practical, real-world financial advice.
Bringing Your Template to Life With Real Numbers
A template is just a starting point; it only becomes powerful when you plug in your own numbers. To make this really clear, let’s walk through an example together.
We’ll use a scenario that’s pretty familiar to many Kiwis: a small, independent café in Auckland. This will show you exactly how to fill out the break-even template and get a sharp, focused picture of your finances.
It all boils down to gathering three key pieces of information from your business records. Let’s tackle them one by one.
First, Pin Down Your Fixed Costs
Fixed costs are those predictable expenses you have to pay every single month, no matter how many coffees you sell or how quiet the day is. Think of them as the cost of keeping the lights on and the doors open.
For most businesses, you can find these figures pretty easily on your Profit and Loss report. If you’re not quite sure what that is or where to find it, our guide on what is a profit and loss statement can help you out.
To give you a better idea of what to look for, here’s a quick breakdown of typical costs.
| Example Costs for an Auckland Cafe | ||
|---|---|---|
| Cost Type | Expense Item | Example Monthly Cost / Per-Unit Cost |
| Fixed Costs | Rent for the premises | $3,500 |
| Staff Wages (salaried) | $6,000 | |
| Insurance | $200 | |
| Software (POS, accounting) | $150 | |
| Utilities (power, internet) | $400 | |
| Variable Costs | Coffee Beans | $0.50 |
| Milk | $0.30 | |
| Cup and Lid | $0.20 |
As you can see from the table, if we add up our café’s fixed costs, they have total fixed costs of $10,250 per month. This is the first number you’ll pop into the template.
Next, Tally Up Your Variable Costs
Now for the variable costs. These are the expenses tied directly to making a sale. For our café, this means the cost of the ingredients that go into every single item sold.
To keep things simple, let’s just calculate the variable cost for their most popular item: a regular flat white.
- Coffee Beans: $0.50
- Milk: $0.30
- Cup and Lid: $0.20
That gives us a total variable cost of $1.00 per coffee. If the café sold other things like muffins or sandwiches, you’d want to work out an average variable cost per transaction, but for this exercise, we’ll stick to the flat white.
Set Your Sale Price and Find the Contribution Margin
The last piece of the puzzle is your average sale price. Our Auckland café sells its regular flat white for $5.00.
With these three numbers—fixed costs, variable costs, and sale price—the template automatically calculates your contribution margin. This is a crucial metric that tells you how much profit each individual sale contributes before you’ve paid your fixed costs.
The formula is straightforward: Sale Price – Variable Costs = Contribution Margin.
For our café, that looks like: $5.00 – $1.00 = $4.00.
This means for every single coffee they sell, the café generates $4.00 that can be put towards chipping away at that big $10,250 pile of monthly fixed costs. Each sale gets them one step closer to breaking even.
Once you have these key figures sorted, you’re ready to plug them into the template and see what the numbers have to say. In the next section, we’ll dive into how to actually read the results and what they mean for your business strategy.
Making Sense of Your Break-Even Results
Alright, you’ve plugged your numbers into the break-even template and the dashboard is showing you the results. This is where the magic happens. But what do these figures actually mean for how you run your business day-to-day? Let’s unpack it.
The template spits out two crucial numbers. First, you’ll see your break-even point in units sold. For our Auckland café example, this might look like: “You need to sell 2,563 coffees this month.” This is a brilliantly simple, direct target. It tells your team precisely how many sales you need to make just to cover your costs.
Then, you get your break-even point in revenue. This simply turns the unit target into a dollar figure, like: “You need to achieve $12,815 in sales.” This is your top-line financial goal, a number you can easily track in your accounting software, like Xero.
Reading the Profitability Chart
Honestly, the most powerful part of the whole exercise is often the visual chart. You’ll see two lines: one for your total costs and one for your total revenue. The exact spot where they cross is your break-even point.
Anything to the left of that intersection point means you’re operating at a loss. But the moment your revenue line climbs above the cost line, you’re in the clear. That’s the sweet spot. Every single sale you make from that point on is pure profit. It’s a fantastic way to see, at a glance, how close you are to making money on any given day.
With New Zealand’s current economic headwinds, this kind of clarity is more important than ever, especially for the services sector which employs around 80% of our workforce. Think about a Kiwi consultant with $10,000 in fixed costs per quarter. If they bill out at $50/hour, they need to log a staggering 334 billable hours just to cover their expenses. Getting your head around these realities is the first step to building a resilient business, a topic you can explore further in these insights on the NZ services sector.
Knowing your break-even point isn’t just about maths; it transforms a vague financial goal into a concrete, actionable sales target. It also gives you a “margin of safety”—a clear picture of how much sales can dip before you start losing money.
From Calculation to Action
Now you can set targets that are both realistic and motivating. Instead of a fuzzy goal like “increase sales,” your team can rally around selling a specific number of units each week or even each day.
If the number staring back at you feels a bit daunting, don’t panic. That’s a totally normal reaction. It’s simply a sign that it’s time to take a closer look at your pricing strategy or find ways to trim your costs.
If you need a hand making sense of your results or figuring out what to do next, we’re here to help. At Business Like NZ Ltd, we’re affordable down-to-earth chartered accountants supporting Auckland businesses and property investors.
Using Your Template for Strategic Decisions
Now that you have your break-even point calculated, the real fun begins. Think of your template not just as a calculator, but as a flight simulator for your business. This is where you can test out ideas and see how they might fly—or crash—before you commit a single dollar in the real world.
The true power of this analysis comes from asking “what if?”. By playing with the numbers, you can model different scenarios and turn a static spreadsheet into a dynamic tool for smart, forward-thinking decisions.
Modelling Price Adjustments
Pricing is one of the toughest nuts to crack for any business owner. Are we too cheap? Too expensive? What would happen if we just nudged the price up a little? Your template can give you a clear answer in seconds.
Simply go into your input sheet and change the ‘Price Per Unit’. Watch what happens to your break-even point.
- Scenario: Let’s say our Auckland café wants to increase its flat white price by $0.50, from $5.00 to $5.50.
- Action: Just change that single cell in the template.
- Result: You’ll immediately see the break-even point in units drop. This shows you exactly how many fewer coffees you need to sell to cover your costs, building a healthier profit margin into every single cup.
This simple exercise is a game-changer. If you’re thinking about a price review, it’s worth reading our guide on building a solid pricing strategy for services for more ideas.
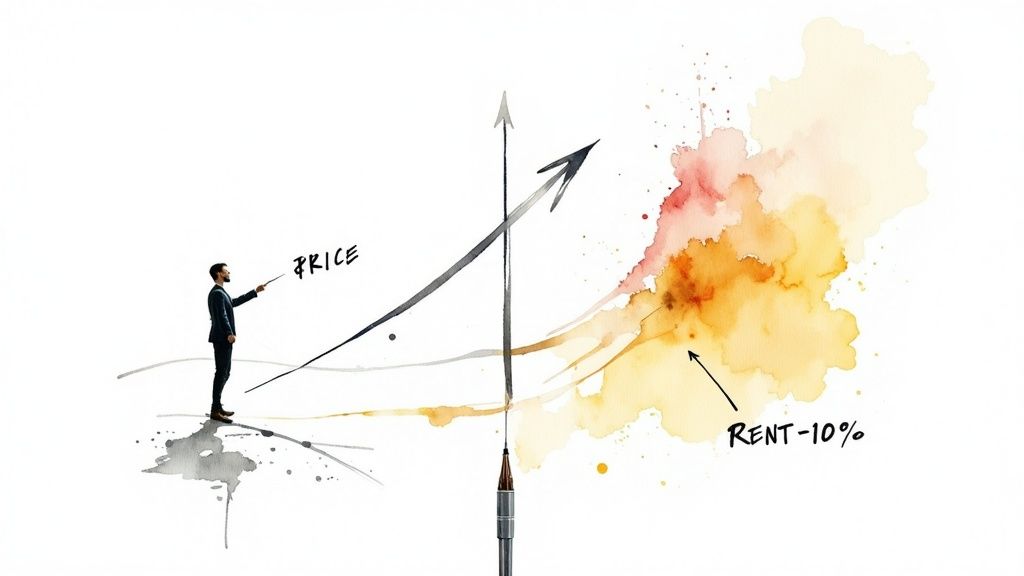
Analysing Changes in Costs
Let’s face it, costs rarely stand still. Your suppliers put their prices up, the landlord increases the rent, and unexpected expenses always seem to pop up. Your break-even template is the perfect tool for seeing how these changes will ripple through your business.
Imagine your landlord just sent an email announcing a 10% rent increase. Don’t panic. Plug that new number into your fixed costs and see what it really means for your targets.
- Scenario: How will a 10% rent increase affect my monthly sales target?
- Action: Update the ‘Fixed Costs’ total in your template.
- Result: The template will instantly recalculate a new, higher break-even point. Now you know exactly how much more revenue you need to bring in just to stay where you are.
This kind of forward-looking analysis is critical across many Kiwi sectors. Take our vital dairy industry, for example. Break-even analysis is constantly used to navigate market pressures. A recent forecast actually saw the break-even milk price drop to $8.50 per kgMS thanks to easing production costs. It’s a small but important shift that helps farmers plan ahead and maintain stability.
By stress-testing your business against potential cost increases, you can get on the front foot. It allows you to proactively adjust your strategy, whether that’s hunting for cost savings or planning a price tweak to protect your bottom line.
Evaluating New Investments
Are you eyeing up a big purchase? Maybe it’s new gear for your trade business or a much-needed fit-out for your retail shop. Before you sign on the dotted line, run it through the template.
You can work out if the investment truly makes financial sense. For example, if a builder is considering financing a new ute for $800 a month, they can add that figure to their fixed costs. The template will instantly show how many extra billable hours they need to work just to cover the vehicle’s cost. It’s a simple check that can save you a lot of future headaches.
If running these scenarios is bringing up more questions than answers, it might be a good time for a chat. At Business Like NZ Ltd, we’re affordable, down-to-earth chartered accountants supporting Auckland businesses and property investors. We can sit down with you, work through these ‘what-if’ scenarios, and build a clear, actionable plan for your success.
Taking Your Financial Strategy to the Next Level
So, you’ve got your break-even point figured out. That’s a huge step – honestly, it gives you a level of financial clarity most business owners only dream of. But let’s be real, just knowing that number is only the beginning.
Building a truly resilient business means weaving this insight into every part of your financial strategy. The template is a brilliant tool, but it’s time to move from simply covering your costs to actively planning for real, sustainable growth. While a DIY analysis is powerful, getting an expert eye over your numbers can help you spot hidden opportunities and sidestep those costly mistakes a spreadsheet can’t warn you about.
Beyond Just Breaking Even
Knowing your numbers is one thing; using them to build a robust future is a whole different ball game. It’s about asking the bigger questions now:
- How does my break-even point actually stack up against my cash flow forecast?
- What’s a realistic profit margin to aim for, not just what I need to survive?
- Can I use this data to confidently approach a lender for funding or report back to my investors?
Answering these properly means taking a much deeper dive into your financials.
Think of it this way: moving beyond breaking even is about creating a “margin of safety.” This is the gap between your current sales and your break-even sales, and it’s what protects your business from a bad month and fuels your future investments. It’s your financial cushion.
If you’re ready to take that next step, we should talk. At Business Like NZ Ltd, we’re affordable down-to-earth chartered accountants supporting Auckland businesses and property investors. We’ll help you go deeper than any template can and build a financial plan that drives genuine growth.
Common Questions About Break-Even Analysis
It’s completely normal to have questions when you start crunching these numbers. I’ve seen hundreds of business owners tackle this for the first time, and a few key questions always pop up. Here are the most common ones I hear, with some straightforward answers to guide you.
How Often Should I Run These Numbers?
As a general rule, I tell my clients to run a break-even analysis at least quarterly. It’s a great way to keep your finger on the pulse of your business’s financial health.
More importantly, though, you need to revisit your template the moment anything significant changes. Think rent increases, hiring a new team member, or a sudden jump in what your suppliers are charging you. If your costs change, your sales targets need to change too, and keeping this analysis current is how you stay on top of it.
What Are the Biggest Mistakes People Make?
The classic mistake I see all the time is misclassifying costs. It’s so easy to accidentally label a fixed cost (like that annual software subscription you pay) as a variable one (like your packaging materials). Get that wrong, and your whole calculation will be off.
Another common slip-up is forgetting to include all your fixed costs. Little things like bank fees or insurance premiums often get missed. The best way to avoid this is to pull up your Profit & Loss statement from Xero and meticulously check every single expense line.
Your break-even point is only as reliable as the data you feed it. Take the time to double-check how you’ve categorised your costs—it’s the most critical step for getting a result you can actually trust.
How Does This Work if I Sell Multiple Products?
Things definitely get a bit more complex when you have a whole range of products or services. The standard approach involves calculating a “weighted-average” contribution margin based on your typical sales mix.
Our template is deliberately kept simple for a single product or a blended average. Honestly, figuring this out accurately for multiple revenue streams is a perfect example of where getting some professional advice can really pay off.
Ready to get a crystal-clear picture of your profitability and map out a solid plan for growth? Business Like NZ Ltd is a team of affordable, down-to-earth chartered accountants supporting Auckland businesses and property investors.
Let’s chat about building a more sophisticated financial model that truly reflects your unique business. Find out how we can help at https://businesslike.co.nz.


