What Is Accounts Receivable Turnover: A Guide
Accounts receivable turnover is a fancy term for a simple idea: how good is your business at collecting the money your customers owe you?
Think of it as a report card for your collections process. A high score—or a high turnover number—means you’re getting cash in the door quickly. And in business, fast cash is king.
Unpacking Accounts Receivable Turnover
Here’s an analogy I like to use: imagine a revolving door. Every time you make a sale on credit, a customer steps in. When they pay their invoice, they step out. The accounts receivable turnover ratio simply measures how fast that door is spinning.
A fast-spinning door means money is flowing in without a hitch. A slow, creaky one? That’s a sign you’ve got a bottleneck somewhere in your collections, and it’s time to figure out why. This isn’t just some abstract number on a spreadsheet; it’s a real-time indicator of your company’s liquidity and how well you’re managing the credit you give out.
Why This Ratio Matters
The accounts receivable turnover ratio shows how many times your business collects its average accounts receivable balance over a specific period, usually a year.
For instance, say your business had $90 million in sales on credit last year, and your average accounts receivable balance was $12 million. Your turnover ratio would be 7.5. This means you collected your full receivables balance about 7.5 times during the year. For a deeper dive into how this works, these insights on the AR turnover ratio from NetSuite are quite useful.
Keeping an eye on this ratio helps you get a handle on a few critical things:
- Cash Flow Health: A higher ratio points to a healthy, steady stream of cash. You need that cash to pay your own bills, invest in inventory, and fuel growth.
- Credit Policy Effectiveness: Is your 30-day payment term actually a 60-day reality? The ratio tells you if your credit policies are working or if they’re too lenient (slowing down payments) or even too strict (and maybe costing you customers).
- Customer Payment Behavior: By tracking this metric, you can spot trends. Are customers starting to pay more slowly? It’s an early warning system.
To really get this, it helps to break down the two main ingredients in the formula.
Key Components of the Accounts Receivable Turnover Ratio
This table lays out the two pieces of the puzzle you’ll need for the calculation. Understanding them is key to interpreting the final number correctly.
| Component | What It Means | Why It’s Important |
|---|---|---|
| Net Credit Sales | This is your total sales made on credit, after you subtract any customer returns or allowances. Crucially, it leaves out cash sales. | Focusing only on credit sales gives you a true picture of your collection efficiency. Cash sales don’t create receivables, so they’re not relevant here. |
| Average Accounts Receivable | This is the average amount of money customers owed you over a period. You find it by adding the beginning and ending receivable balances and dividing by two. | Using an average smooths out any big spikes or dips in your receivables. This gives you a much more balanced and accurate look at your typical outstanding balance. |
Once you have these two numbers, you’re ready to calculate the ratio and see what it says about your business’s financial health.
How to Calculate Your Accounts Receivable Turnover Ratio
Alright, let’s get our hands dirty and actually run the numbers. Calculating your accounts receivable turnover ratio might sound intimidating, but it’s simpler than you think. It really just boils down to one straightforward formula.
The magic formula is: Net Credit Sales / Average Accounts Receivable
Let’s pull that apart so you know exactly what you’re looking for and where to find it on your financial statements.
Step 1: Find Your Net Credit Sales
First up, we need to figure out your Net Credit Sales. This isn’t your total revenue—it’s a very specific number. We’re only interested in the sales you made on credit, the ones where you sent an invoice and waited for the customer to pay.
To get this right, you have to exclude two things:
- Cash Sales: Any time a customer paid you on the spot, that money isn’t a “receivable.” It’s already in the bank, so it doesn’t count here.
- Returns and Allowances: You also need to subtract the value of any goods customers returned or any discounts you offered for things like damaged products.
The best place to find this information is your income statement. It’ll show your gross sales, and from there you can subtract your cash sales and any returns to get to your true net credit sales for the period.
Why This Matters: Using net credit sales is non-negotiable. If you include cash sales or forget to subtract returns, you’ll artificially inflate your turnover ratio. That gives you a false sense of security, making it look like you’re collecting cash faster than you actually are.
Step 2: Figure Out Your Average Accounts Receivable
The second piece of the puzzle is your Average Accounts Receivable. Think of this as the typical amount of money customers owe you at any given point during the time frame you’re measuring.
We use an average because it smooths out the bumps. A single month with unusually high or low sales could otherwise throw off your calculation, but an average gives you a much more balanced and realistic picture of your outstanding invoices.
Here’s the simple way to calculate it:
- Find the Beginning Balance: Grab your balance sheet and look for the accounts receivable total at the very start of the period (say, January 1st).
- Find the Ending Balance: Now, find the AR total from the very end of that same period (December 31st).
- Do the Math: Just add the beginning and ending balances together and divide by two. Easy.
(Beginning AR + Ending AR) / 2 = Average Accounts Receivable
For instance, if your business had $20,000 in AR at the start of the year and $30,000 at the end, your average accounts receivable would be $25,000.
Once you have both your Net Credit Sales and your Average Accounts Receivable, you’re ready to plug them into the main formula and see what your turnover ratio really is.
Putting Accounts Receivable Turnover Into Practice
Alright, let’s move beyond the theory. The best way to really get a feel for accounts receivable turnover is to see it in action. We’re going to walk through a real-world scenario to show you how a business can use this metric to diagnose and solve a very real problem. It’s one thing to know the formula; it’s another to see why it matters.
Picture a small, growing craft supply shop—we’ll call it “Creative Corner.” The owner has a classic problem: sales reports look good, but the bank account is always running on fumes. This constant cash flow crunch is a huge source of stress. It’s making it tough to stock up on new inventory or pay suppliers on time. The owner has a hunch that slow-paying customers are the culprit.
Gathering the Financial Data
To test that theory, the owner decides it’s time to calculate the shop’s accounts receivable turnover ratio for last year. This means digging into the books for a few key numbers.
Here’s the data Creative Corner pulls for the year:
- Total Credit Sales: $150,000
- Sales Returns: $5,000
- Beginning Accounts Receivable (Jan 1st): $18,000
- Ending Accounts Receivable (Dec 31st): $22,000
With these figures on hand, the owner is ready to get a clear, unbiased look at how efficiently the shop is collecting its money.
Plugging in the Numbers
First up, they need to figure out the Net Credit Sales. That’s just the total credit sales minus what customers returned.
$150,000 (Total Credit Sales) – $5,000 (Returns) = $145,000

Next, they calculate the Average Accounts Receivable for the year.
($18,000 (Beginning) + $22,000 (Ending)) / 2 = $20,000
Finally, they can plug both of those numbers into the turnover formula.
$145,000 (Net Credit Sales) / $20,000 (Average AR) = 7.25
This kind of practical analysis isn’t new. It’s a tried-and-true method for checking a company’s pulse. For example, a 2017 case study on Trinity Bikes Shop showed they had $100,000 in gross credit sales and $10,000 in returns. Their average accounts receivable was $12,500, giving them a turnover ratio of 7.2. This told them they were turning over their receivables a little more than seven times a year. You can see more examples of turnover ratios in action to get a sense of how common this is.
For Creative Corner, the 7.25 ratio was the “aha!” moment. It meant the shop was collecting its entire outstanding balance about seven times a year. This wasn’t just some number on a spreadsheet; it was a powerful insight. It turned that vague, nagging feeling of “slow payments” into a hard metric they could now track, benchmark, and, most importantly, improve.
What Your Accounts Receivable Turnover Ratio Reveals
So you’ve run the calculation and have your accounts receivable turnover ratio. Awesome. But that number isn’t just a piece of data to tuck into a report—it’s telling you a story about your company’s financial pulse. Now it’s time to learn how to read it.
Interpreting your ratio isn’t about hitting some universal “good” number. Think of it more like a diagnostic tool. It’s the starting point that helps you ask smarter questions about who you’re giving credit to and how you’re collecting what you’re owed.
The Story Behind a High Ratio
At first glance, a high turnover ratio looks fantastic. A ratio of 10, for instance, means you’re turning your receivables into cash ten times a year, or about every 36 days. That usually signals an efficient collections process and solid cash flow. You’re getting paid, and you’re getting paid fast.
But hold on—a number that’s too high might be a hidden warning. It could mean your credit policies are way too tight. If you’re demanding lightning-fast payments or barely offering credit at all, you might be chasing away great customers who just need a bit more breathing room. In that case, you might be winning the cash flow battle but losing the sales war to competitors with more reasonable terms.
A high ratio indicates that you have an efficient and effective collection process. It shows that your customers are paying their invoices quickly, which is great for liquidity and reducing your reliance on financing.
The Implications of a Low Ratio
A low turnover ratio, on the other hand, is often an immediate red flag. Let’s say your ratio is 4. That means it’s taking you around 90 days to get paid. That kind of lag can put a serious chokehold on your cash flow, making it tough to pay your own bills, cover payroll, or jump on growth opportunities.
A consistently low or falling ratio is often a symptom of deeper issues, such as:
- Ineffective collection procedures: Maybe your team isn’t following up consistently or is waiting too long to make the first call.
- Lenient credit policies: You could be extending credit to customers who are on shaky financial ground.
- Rising bad debt risk: The older an invoice gets, the higher the chance you’ll never see that money at all.
However, context is everything. A business might intentionally offer generous payment terms as a strategy to woo a major client or break into a competitive market. In this scenario, a lower ratio is a calculated trade-off, not a sign of poor management. The key is to know whether it’s a deliberate choice or a problem that’s quietly getting out of hand.
Comparing Your Turnover Ratio Across Industries
Knowing your accounts receivable turnover ratio is a great first step, but the number is pretty much useless on its own. Without context, it’s just a number. A ratio that looks amazing for one business could be a five-alarm fire for another. Context is everything, and the best way to get it is by stacking your performance up against industry benchmarks.
The kind of business you run makes a world of difference here. Think about it: a busy retail store or an e-commerce shop handling tons of small transactions will naturally have a very high turnover. Most customers pay right away or within a few weeks, keeping the cash cycle short and sweet. On the other hand, a construction company or heavy manufacturer deals with long projects and complex contracts, which means much longer payment terms and, you guessed it, a lower turnover ratio.
Translating Turnover Into Days
The turnover ratio is helpful, but let’s be honest, it can feel a bit abstract. A much more intuitive way to grasp your collection speed is by converting that ratio into Days Sales Outstanding (DSO). This metric gives you a straight-up answer, telling you the average number of days it takes you to actually get paid after you’ve made a sale.
For example, an AR turnover of 7 means you have a DSO of about 52 days (365 divided by 7). High-performing industries like tech and retail often see turnover rates above 10, which translates to a DSO of less than 36 days. Meanwhile, sectors like construction might have a turnover closer to 5, pushing their DSO over 70 days to reflect those longer payment cycles common in their field.
This image breaks down a simple example, with Net Credit Sales of $1,000,000 and Average Accounts Receivable of $200,000, giving us a turnover ratio of 5.
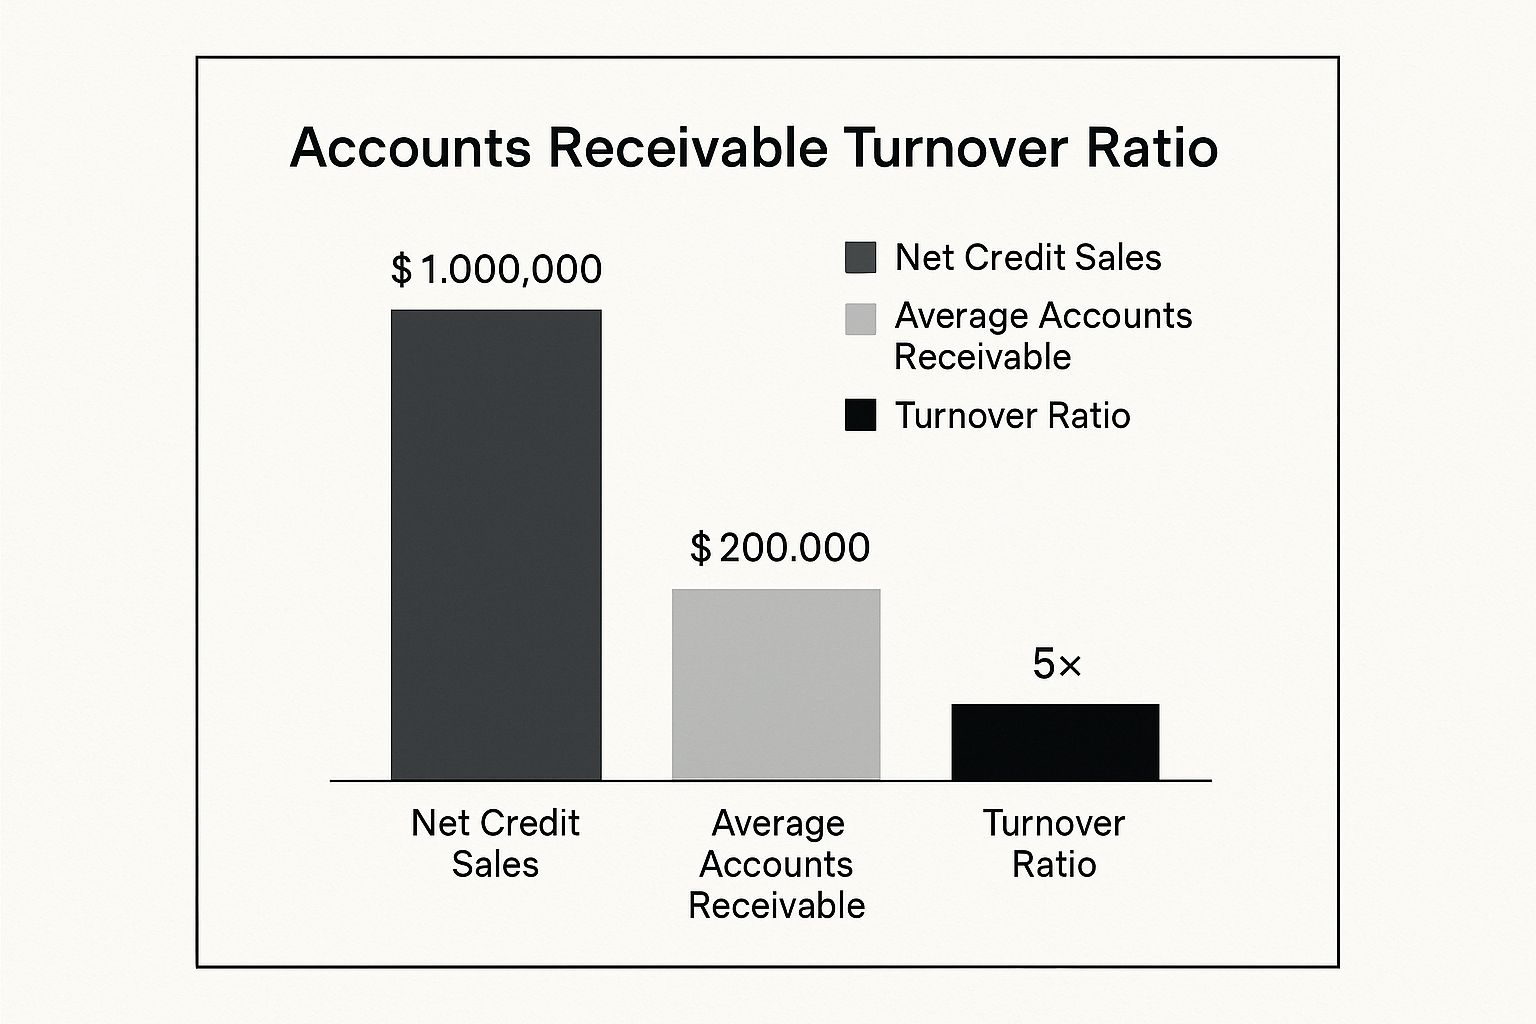
A ratio of 5 means this company collects its entire receivables balance five times a year. In simpler terms, that’s about once every 73 days (365 / 5).
Typical AR Turnover and DSO by Industry
To give you a clearer picture, here’s a look at how AR turnover and DSO can vary dramatically from one industry to the next.
| Industry | Typical AR Turnover Ratio | Approximate Days Sales Outstanding (DSO) |
|---|---|---|
| Retail & E-commerce | 10.0 – 20.0 | 18 – 36 days |
| Technology & SaaS | 8.0 – 12.0 | 30 – 45 days |
| Professional Services | 6.0 – 9.0 | 40 – 60 days |
| Manufacturing | 5.0 – 8.0 | 45 – 73 days |
| Construction | 4.0 – 6.0 | 60 – 91 days |
This table highlights just how critical it is to compare apples to apples. A DSO of 65 days might be cause for concern in the tech world, but it could be perfectly normal, or even good, for a construction firm.
Benchmarking for a Strategic Edge
Comparing your numbers to the averages in your industry helps you set realistic goals and see how you’re really doing. Are you collecting cash faster or slower than your direct competitors? Answering that question is fundamental to smart strategic planning.
Key Insight: Never judge your ratio in a vacuum. A “good” number is completely relative. Your real goal should be to perform at or, ideally, above your industry’s average while making sure it fits your own business model and goals.
Actionable Ways to Improve Your AR Turnover
So, your ratio isn’t quite where you want it to be. Don’t worry, this is a common challenge. Now’s the time to shift from just looking at the numbers to taking concrete steps to fix them. Improving your accounts receivable turnover is all about shortening the time it takes for customers to pay you, which gives your cash flow a direct and healthy boost.
The great thing is, there are plenty of practical ways to do this without alienating your valuable customers. It’s all about being proactive, not reactive. With a few smart adjustments, you can encourage quicker payments and stop invoices from gathering dust and turning into bad debt. Your main goal? Make it as easy and painless as possible for people to pay you.
Refine Your Invoicing and Payment Process
One of the biggest culprits behind slow payments is simple confusion. If your invoices are vague or your payment process feels like an obstacle course, you’re unintentionally creating delays. Start here: make sure every single invoice is crystal clear. It should spell out exactly what the customer is paying for, the due date, and the different ways they can pay.
Offering a variety of payment options is another game-changer. When you accept credit cards, bank transfers, and online payments, you’re removing barriers. You’re making it more convenient for your customers to settle up on time, which is a win-win.
Key Takeaway: A smooth, easy process is your secret weapon. Even a small tweak, like offering a discount for early payment, can work wonders. It gives customers a real incentive to pay you sooner, which can help balance out the late payers and instantly improve your turnover.
Automate and Systemize Your Collections
Let’s be honest: consistently following up on unpaid invoices is crucial, but it also eats up a ton of time. This is where automation can completely change the game. One of the most effective ways to speed things up is by automating invoice processing and setting up automatic payment reminders.
Try putting these proven methods into practice:
- Establish Clear Payment Terms: Don’t wait until the first invoice goes out. Make sure your customers know your payment expectations right from the very start of your relationship.
- Set Up Automated Reminders: Dive into your accounting software and set up a system to send polite, automated reminders for payments that are coming due or are already late. This ensures nothing gets missed.
- Create a Firm Collections Policy: For those seriously overdue accounts, you need a plan. Create a clear, step-by-step internal policy for how and when you’ll escalate your collection efforts.
Taking these steps helps build a system that’s far more predictable and efficient. And if you’re looking for more inspiration, you can explore other strategies to improve your business cash flow that go hand-in-hand with a better turnover ratio.
Your Questions About Accounts Receivable Answered

Once you start digging into your accounts receivable turnover ratio, a few practical questions almost always come up. It’s one thing to know the formula, but another to really understand what it’s telling you.
Let’s walk through some of the most common questions we hear from business owners. Getting these sorted will help you use this metric with confidence and avoid reading the signs wrong.
Can My Accounts Receivable Turnover Be Too High?
You bet it can. While a high number usually gets a thumbs-up for efficient collections, a sky-high ratio can actually be a warning sign. It often means your credit policies are too strict.
Think about it: if you’re demanding immediate payment or refusing to offer credit when your competitors are more flexible, you might be choking off your sales. You could be scaring away perfectly good customers who just need a little breathing room on payment terms. The sweet spot is finding a balance—collecting cash quickly without putting yourself at a competitive disadvantage.
How Often Should I Calculate This Ratio?
That really depends on how hands-on you want to be with your cash flow. At a bare minimum, you should calculate it annually. This gives you that big-picture view for year-over-year comparisons and long-term strategy.
But for day-to-day, real-world cash management, looking at it quarterly or even monthly is far more powerful. This shorter timeframe gives you timely feedback, allowing you to catch a negative trend before it snowballs into a major cash crunch.
Think of more frequent calculations as an early warning system. You can see the immediate impact of a new collections strategy or a change in your credit terms, giving you the agility to tweak things as you go.
What Is the Difference Between AR Turnover and Inventory Turnover?
This is a great question. Both are crucial efficiency ratios, but they’re measuring two very different, though connected, parts of your business operations.
- Accounts Receivable Turnover tells you how efficiently you collect the cash from your customers after the sale is made. It’s all about getting paid.
- Inventory Turnover shows how quickly you’re selling your products in the first place. This is about moving goods off the shelves.
So, a high AR turnover means you’re a rockstar at collecting money. A high inventory turnover means you’re a rockstar at selling your stock. You really need both to be humming along for a truly healthy business.
At Business Like NZ Ltd, we help small to medium businesses in Auckland move beyond just staring at numbers and toward building real financial freedom. If you need expert advice on improving your cash flow and running a smarter business, we’re here to help.