Fixed vs. Variable Costs
Decoding Your Business Expenses
Understanding the difference between fixed and variable costs is crucial for managing your Auckland business’s finances. This listicle explains these key concepts, empowering you to analyze expenses, make informed decisions, and improve profitability. We’ll cover cost behavior, break-even analysis, operating leverage, contribution margin, cost structure strategy, and relevant range/step costs. Knowing how your costs behave helps you control spending, price products effectively, and ultimately boost your bottom line.
1. Cost Behavior and Classification
Understanding the difference between fixed and variable costs is fundamental to sound financial management for any business, especially for small businesses in Auckland looking to optimize their operations. Cost behavior and classification is the principle that categorizes costs based on how they respond to changes in business activity. This categorization is crucial for accurate financial forecasting, budgeting, break-even analysis, and informed pricing decisions. Essentially, it helps you predict how your expenses will change as your business grows or contracts.
Fixed costs remain constant regardless of your production volume or sales. Think of expenses like rent for your office space, insurance premiums, or salaries for permanent staff. These costs don’t change whether you sell 10 units or 100 units. Within a specific range of activity – often called the “relevant range” – these costs remain stable. For instance, your rent might stay the same whether you produce 1,000 widgets or 2,000 widgets. However, if your production increases significantly beyond this range, you might need a larger facility, which would increase your rent.
Variable costs, on the other hand, fluctuate directly with your activity levels. These are expenses tied to production or sales, such as raw materials, packaging, shipping costs, and sales commissions. If you produce more, you’ll need more raw materials, thus increasing your variable costs. Conversely, a decrease in production leads to a decrease in these costs. For example, a bakery’s ingredient costs (flour, sugar, etc.) are variable costs directly tied to the number of cakes baked.
Some costs are trickier to classify because they have both fixed and variable components. These are known as mixed costs or semi-variable costs. An example would be your phone bill, which might have a fixed monthly line rental fee and a variable cost based on the number of calls made. Understanding these nuances allows you to make better decisions about resource allocation and pricing strategies.
The following infographic visualizes the relationship between total costs, fixed costs, and variable costs.
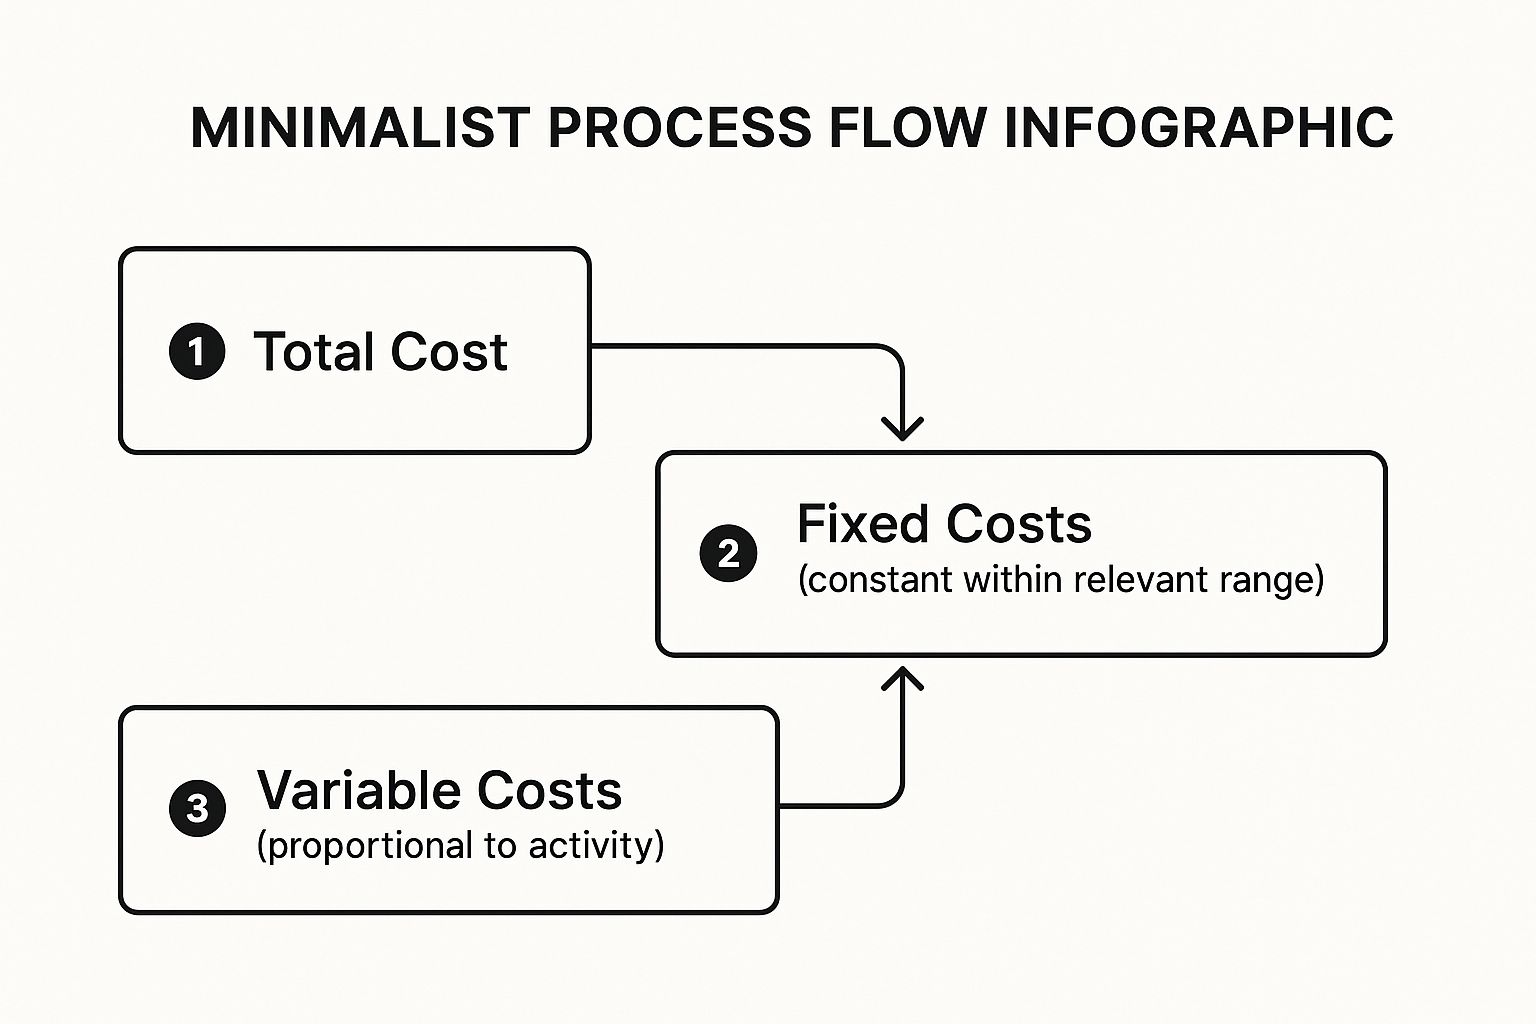
The infographic clearly shows how total costs are derived by adding together the fixed costs, which remain constant, and the variable costs, which change based on activity. This visualization emphasizes the important distinction between these cost types and how they contribute to the overall cost structure of a business.
Accurately classifying costs offers several advantages. It enables more precise financial forecasting, which improves budgeting and planning accuracy. This, in turn, facilitates break-even analysis, helping you determine the sales volume needed to cover all costs. This knowledge is especially valuable for Auckland businesses facing competitive market pressures. Further, understanding your cost structure empowers you to make informed pricing decisions, ensuring profitability and competitive pricing strategies.
However, cost classification isn’t without its challenges. It can sometimes be subjective, and the behavior of costs may change outside the relevant range. Some costs are inherently difficult to categorize neatly as either fixed or variable. For instance, while marketing costs are often considered fixed, some components, like pay-per-click advertising, are actually variable. Relocating to a different business premise comes with numerous expenses, both fixed and variable. Understanding these costs, like the cost of relocating from one country to another, is crucial for efficient budgeting. These complexities highlight the need for regular review and adjustments to your cost classifications as your business evolves.
Here are a few practical tips: Regularly review your cost classifications, especially as your business grows or changes. Use scatter plots to visualize cost behavior patterns, which can help you identify trends and anomalies. Consider the time horizon when classifying costs, as a cost that is fixed in the short term might become variable in the long term. Finally, document your assumptions for future reference and to ensure consistency in your financial analysis. By mastering cost behavior and classification, Auckland businesses can enhance their financial management, make more informed decisions, and position themselves for sustainable growth.
2. Break-Even Analysis
Understanding the difference between fixed and variable costs is crucial for any business, especially for small businesses in Auckland looking to optimize their operations. One of the most powerful applications of this understanding lies in break-even analysis. This critical financial technique helps you determine the point where your total revenues equal your total costs, resulting in neither profit nor loss. In essence, it tells you how much you need to sell to cover all your expenses. By grasping the relationship between fixed costs (those that remain constant regardless of output, like rent), variable costs (those that fluctuate with production, like raw materials), and your selling price, you can make informed decisions about pricing strategies, production levels, and ultimately, the viability of your business.

Break-even analysis empowers you to calculate the minimum sales volume required to cover all your expenses. This is essential for setting realistic sales targets and evaluating the potential impact of changes in your costs. Imagine you own a café in Auckland. Your fixed costs might include rent, salaries, and equipment leases. Your variable costs include ingredients, packaging, and electricity consumption, which increase with the number of coffees and meals you sell. Break-even analysis helps you determine how many coffees and meals you need to sell each month to cover these costs.
The core of a break-even analysis lies in this formula: Break-even point (in units) = Fixed Costs ÷ (Selling Price – Variable Cost per Unit). This straightforward calculation provides a quick snapshot of your business’s viability. For example, if your fixed costs are $10,000 per month, your selling price per unit is $20, and your variable cost per unit is $10, your break-even point is 1,000 units. This means you need to sell 1,000 units to cover all your costs.
Beyond the basic break-even point, this analysis offers several other valuable features. The margin of safety calculation reveals the cushion you have above your break-even point, indicating how much your sales can drop before you start incurring losses. The contribution margin shows the profit potential of each unit sold, helping you understand the impact of pricing changes. Graphical representations of cost-volume-profit relationships provide a visual overview of your business’s financial performance. Finally, sensitivity analysis allows you to test the impact of changing variables, such as increases in raw material costs or changes in selling price, on your break-even point.
While break-even analysis offers numerous advantages for Auckland businesses, it’s important to be aware of its limitations. It assumes a linear relationship between costs and sales, which may not always be accurate in the real world. It also tends to ignore market demand constraints and, in its basic form, focuses on a single product. Furthermore, it’s a static analysis that doesn’t account for business growth or changing market dynamics.
Despite these limitations, break-even analysis remains a valuable tool for decision-making, especially for small businesses. Here are some tips to make the most of it: Update your analysis regularly as costs and prices change, consider multiple scenarios with different assumptions to account for uncertainty, include opportunity costs in your analysis for a more comprehensive view, and use break-even analysis alongside other financial metrics for a well-rounded understanding of your business performance.
For Auckland businesses operating in competitive markets, understanding the difference between fixed and variable costs and utilizing break-even analysis can be the difference between success and failure. By providing a clear picture of your cost structure and profitability drivers, break-even analysis allows you to make informed decisions about pricing, production, and resource allocation, ultimately helping you achieve sustainable profitability. Examples of successful implementations include large corporations like Tesla using it for new production lines and Starbucks for new store locations, demonstrating its relevance across scales. Even airlines use break-even analysis to determine optimal passenger loads for their routes. By adapting these principles to your Auckland business, you can gain a competitive edge in the local market.
3. Operating Leverage
Understanding the difference between fixed and variable costs is crucial for any business, but especially so for small businesses in Auckland. One key concept that links directly to this understanding is operating leverage. Operating leverage is a financial metric that reveals how sensitive a company’s operating income (profit before interest and taxes) is to changes in sales revenue. This sensitivity is directly tied to the proportion of fixed costs versus variable costs within the company’s overall cost structure. In simpler terms, it helps you understand how much your profit will change when your sales change.

Companies with a higher proportion of fixed costs in their operations have higher operating leverage. This means that a small percentage change in sales can lead to a much larger percentage change in operating income. Imagine a software company like Xero, which is popular among Auckland businesses. They have high fixed costs associated with developing their software, but the cost of serving each additional customer (variable cost) is relatively low. If their sales increase by 10%, their profits might increase by 20% or more due to the high operating leverage. Conversely, a small drop in sales can significantly impact their profitability.
The degree of operating leverage can be calculated with a simple formula:
Degree of Operating Leverage = % Change in Operating Income / % Change in Sales
For example, if a 5% increase in sales results in a 15% increase in operating income, the degree of operating leverage is 3 (15% / 5% = 3). This indicates that profits are highly sensitive to sales fluctuations.
Operating leverage tends to decrease as sales volume increases. As a company grows, the fixed costs become spread over a larger sales base, reducing their impact on profitability. This creates scalability potential, as the business can achieve higher profit margins as sales grow.
High operating leverage, while offering significant profit potential, also amplifies losses. This is why understanding the difference between fixed and variable costs is so critical for Auckland businesses. If your business model relies heavily on fixed costs, you’ll experience greater volatility in your profits. During economic downturns, this can be particularly challenging.
Pros of High Operating Leverage:
- Significant profit potential with sales increases: Even small increases in sales can translate to substantial profit growth.
- Economies of scale benefits: As production increases, the fixed cost per unit decreases, leading to higher profitability.
- Competitive advantage through cost structure: Lower variable costs can allow for competitive pricing strategies.
- Higher margins once break-even is achieved: Once fixed costs are covered, a larger portion of each additional sale contributes to profit.
Cons of High Operating Leverage:
- Higher business risk and volatility: Profits are highly sensitive to sales fluctuations, increasing the risk of losses during downturns.
- Greater sensitivity to economic downturns: A drop in sales can significantly impact profitability due to the burden of fixed costs.
- Requires higher sales volume to break even: More sales are needed to cover the higher fixed costs before profits can be realized.
- Less flexibility in cost management: Fixed costs are difficult to adjust quickly in response to changing market conditions.
Examples relevant to Auckland businesses:
- Software companies: High development costs (fixed) but low marginal costs for each additional user.
- Cafes and restaurants: Rent and equipment are fixed costs, while ingredients are variable.
- Retail stores: Lease payments are fixed, while cost of goods sold is variable.
Actionable tips for Auckland businesses:
- Monitor your operating leverage ratio regularly: Track how changes in sales impact your profits to understand your business’s sensitivity.
- Strategically balance fixed and variable costs: Consider leasing equipment instead of purchasing to reduce fixed costs. Negotiate favorable terms with suppliers to control variable costs.
- Consider market stability when choosing a cost structure: If your industry is prone to fluctuations, a lower operating leverage might be more suitable.
- Plan for various sales scenarios: Develop budgets and forecasts for different sales levels to understand the potential impact on profitability.
- Seek advice from a financial advisor: A local advisor can provide tailored guidance on managing your cost structure and optimizing your operating leverage for the Auckland market.
By understanding operating leverage and the difference between fixed and variable costs, Auckland businesses can make informed decisions about their cost structure, pricing strategies, and overall financial planning. This knowledge empowers businesses to maximize profitability during periods of growth while mitigating risks during economic downturns.
4. Contribution Margin Analysis
Understanding the difference between fixed and variable costs is fundamental to sound financial management. One powerful tool that leverages this understanding is Contribution Margin Analysis. This managerial accounting technique provides valuable insights into product profitability and helps businesses, especially small businesses in Auckland, make informed decisions about pricing, product mix, and resource allocation. It clarifies which products are truly driving profit and which might be dragging down your bottom line, ultimately contributing to a more profitable and sustainable business.
Contribution Margin Analysis calculates the difference between sales revenue and variable costs. This difference, the contribution margin, represents the portion of revenue that contributes to covering fixed costs and, ultimately, generating profit. Think of it this way: after you’ve paid for the direct costs of producing a product or service (your variable costs), what’s left over is the contribution margin. This remaining amount then goes towards paying your rent, salaries, and other fixed expenses. Once those are covered, anything left is your net profit.
Here’s how it works: The core formula is simple:
Contribution Margin = Sales Revenue – Variable Costs
This can be expressed in total dollars, per unit, or as a percentage (the contribution margin ratio). The contribution margin ratio is calculated as:
Contribution Margin Ratio = Contribution Margin ÷ Sales Revenue
Let’s say you own a bakery in Auckland specializing in artisan bread. Your variable costs for a loaf of sourdough might include flour, yeast, and the baker’s hourly wage. Your fixed costs would include rent, utilities, and your bakery oven. If you sell a loaf of sourdough for $8, and the variable costs per loaf are $3, your contribution margin per loaf is $5. Your contribution margin ratio would be $5 / $8 = 62.5%. This tells you that 62.5% of every dollar earned from selling sourdough goes towards covering your fixed costs and contributing to profit.
Why is Contribution Margin Analysis important for Auckland businesses?
For small businesses in Auckland’s competitive market, understanding profitability is crucial. Contribution Margin Analysis offers several key benefits:
- Clear Picture of Product Profitability: It allows you to pinpoint the profitability of individual products or services, rather than just looking at overall business profitability. This is crucial for optimizing your product offerings and making strategic decisions about which products to prioritize.
- Simplified Pricing Decisions: Knowing your contribution margin empowers you to make informed pricing decisions. You can see the direct impact of price changes on profitability, allowing you to adjust pricing strategically to maximize revenue and profits.
- Product Mix Optimization: By analyzing the contribution margins of different products, you can identify your most profitable offerings and optimize your product mix accordingly. This might involve focusing on high-margin products, phasing out low-margin ones, or introducing new products with strong contribution margin potential.
- Supports Make-or-Buy Decisions: Contribution Margin Analysis can inform decisions about whether to produce a product in-house or outsource its production. Comparing the contribution margin of making a product versus buying it can reveal the most cost-effective option.
Examples of Successful Implementation:
Imagine a local Auckland cafe using contribution margin analysis to assess the profitability of their menu items. They might find that their flat whites have a higher contribution margin than their filter coffee, leading them to promote flat whites more heavily. Or, a clothing boutique could use this analysis to determine which clothing lines are the most profitable, allowing them to optimize their inventory and purchasing decisions.
Actionable Tips for Auckland Businesses:
- Focus on contribution margin per unit of constraint: Identify your limiting factor (e.g., limited shelf space, baker hours) and analyze contribution margin per unit of that constraint. This helps you maximize profit given your limitations.
- Consider both absolute and percentage margins: A high percentage margin doesn’t always translate to high overall profit. Consider both the percentage margin and the absolute dollar contribution.
- Regularly review variable cost assumptions: Variable costs can fluctuate, so regularly review your assumptions to ensure your analysis remains accurate.
- Use for short-term decision making: Contribution margin analysis is best suited for short-term decisions, as fixed costs can change over the long term.
Pros and Cons:
While highly beneficial, Contribution Margin Analysis has limitations:
- Ignores fixed cost allocation: It doesn’t address how fixed costs are allocated to different products.
- May not reflect full product cost: Focusing solely on variable costs can provide an incomplete picture of the true cost of a product.
- Can mislead in capacity-constrained situations: In situations with limited resources, focusing solely on contribution margin might lead to suboptimal decisions.
Despite these limitations, Contribution Margin Analysis remains a powerful tool for understanding product profitability and making informed business decisions. Learn more about Contribution Margin Analysis to delve deeper into this valuable technique. By understanding and utilizing Contribution Margin Analysis, small businesses in Auckland can gain a competitive edge and drive sustainable growth.
5. Cost Structure Strategy
Understanding the difference between fixed and variable costs is crucial for any business, but especially so for small businesses in Auckland. Managing these costs effectively isn’t just about tracking numbers; it’s about developing a robust cost structure strategy. This strategic decision-making process involves carefully designing your company’s mix of fixed and variable costs to best align with your specific business objectives, the prevailing market conditions in Auckland, and your overall risk tolerance. It essentially dictates how your business operates and competes within the local market. This is why cost structure strategy deserves a prominent place on this list. A well-defined strategy can significantly impact your profitability, scalability, and long-term sustainability.
Cost structure strategy boils down to choosing where you want to place more emphasis – on fixed costs or variable costs. This choice influences your business model and operational design. Are you going to be an asset-heavy business, investing significantly in infrastructure and equipment (leading to higher fixed costs), or will you adopt an asset-light approach, outsourcing functions and leveraging variable cost structures? This fundamental decision has cascading effects on various aspects of your business.
Features of a Cost Structure Strategy:
- Strategic Choice: Consciously deciding on the balance between fixed and variable costs.
- Scalability and Flexibility: Influences how easily you can adapt to changes in demand. Higher variable costs generally offer greater flexibility, while higher fixed costs can provide economies of scale when volumes are high.
- Risk Profile and Returns: Impacts your business’s risk exposure and potential profitability. High fixed costs mean higher operating leverage, magnifying both profits and losses.
- Competitive Positioning: Affects how you compete in the Auckland market. A lower cost structure can enable competitive pricing.
- Operational Model Design: Shapes your core operations, including production, staffing, and service delivery.
Pros:
- Alignment with Business Strategy: A well-defined cost structure directly supports your overall business goals.
- Optimized Risk-Return Profile: Balancing fixed and variable costs helps manage risk while maximizing potential returns.
- Enhanced Competitive Advantage: A cost-effective structure can differentiate you from competitors in the Auckland market.
- Improved Financial Performance: Efficient cost management contributes directly to profitability.
Cons:
- Difficult to Change: Once established, a cost structure can be challenging to alter quickly.
- May Limit Strategic Options: Your chosen structure may restrict your ability to pursue certain opportunities.
- Requires Accurate Market Forecasting: Effective cost structure planning relies on accurate predictions of future demand and market conditions in Auckland.
- Industry Constraints May Apply: Certain industries in Auckland, such as manufacturing or hospitality, may have inherent cost structures that are difficult to deviate from.
Examples:
Consider the difference between ride-sharing services like Uber and traditional taxi companies in Auckland. Uber operates with a predominantly variable cost model, classifying drivers as contractors, thereby shifting expenses like vehicle maintenance and insurance to the drivers. Traditional taxi companies, on the other hand, typically own their fleet and employ drivers directly, resulting in higher fixed costs.
Another example is cloud computing services. Many providers offer pay-per-use pricing, allowing businesses to scale their IT infrastructure based on demand, thus transforming traditionally fixed IT costs into variable expenses. This is particularly beneficial for small businesses in Auckland, allowing them to access enterprise-level technology without significant upfront investment. Similarly, outsourcing manufacturing versus in-house production represents a key decision regarding fixed versus variable costs.
Tips for Auckland Businesses:
- Align Cost Structure with Business Strategy: Your cost structure should directly support your overarching business goals and target market within Auckland. If your strategy is rapid growth, a flexible, variable cost structure might be preferable. If your focus is on market share dominance through price competitiveness, minimizing costs becomes crucial.
- Consider Industry Dynamics and Competition: Analyze the typical cost structures of your competitors in the Auckland market and understand the local industry landscape. Identify opportunities for differentiation and cost advantages.
- Evaluate Flexibility Versus Efficiency Trade-offs: While variable costs provide flexibility, fixed costs can offer greater efficiency when volumes are high. Carefully consider the balance that best suits your specific business needs.
- Plan for Different Growth Scenarios: Model your costs under different growth scenarios. This helps you understand the implications of your chosen cost structure and prepare for potential challenges or opportunities in the Auckland market.
By carefully considering these factors, small businesses in Auckland can develop a cost structure strategy that supports their growth and enhances their competitive advantage within the local market. Understanding the difference between fixed and variable costs isn’t just about bookkeeping; it’s a strategic imperative for long-term success.
6. Relevant Range and Step Costs
Understanding the difference between fixed and variable costs is crucial for any business, especially small businesses in Auckland looking to optimize their operations. However, this understanding needs to go beyond simple definitions. The relationship between activity levels and costs isn’t always straightforward. This is where the concepts of relevant range and step costs come into play, adding a layer of nuance to cost analysis and providing more accurate insights into your business’s financial landscape.
The relevant range refers to a specific range of activity levels within which the assumed behavior of fixed and variable costs holds true. Outside of this range, the cost behavior patterns may change significantly. For example, your rent (a fixed cost) may remain the same within a certain production volume. However, if your production dramatically increases, you might need to lease additional space, thereby increasing your rent and changing the fixed cost structure. Similarly, while the cost of raw materials (a variable cost) might be consistent per unit within a certain range, you could negotiate bulk discounts at higher production volumes, altering the per-unit variable cost.
Step costs, on the other hand, represent expenses that remain fixed for a specific range of activity but jump to a higher level once a certain threshold is crossed. They introduce a stair-step pattern to your cost structure. Step costs are often associated with capacity. Think of it like adding staff to your team. One supervisor can manage a team of 10 employees effectively. But if you hire 11, 12, or even up to 20 employees, that same supervisor might still be sufficient. The supervisory cost remains fixed. However, if you expand to 21 or more employees, you’ll likely need a second supervisor, creating a step-up in your supervisory costs.
Understanding these concepts is essential for accurate cost prediction and effective capacity planning. Let’s consider some examples relevant to Auckland businesses:
- Manufacturing: A small manufacturing business in Penrose might have one production line supervisor for every 25 workers. If they plan to increase production and hire another 10 workers, their supervisory costs will remain fixed. But if they hire an additional 16 workers, pushing the total beyond 50, they’ll need a second supervisor, thus increasing their supervisory cost—a classic example of a step cost.
- Software as a Service (SaaS): An Auckland-based SaaS startup might have its software hosted on a single server capable of handling 10,000 users. As their user base grows within that limit, the server cost remains fixed. However, if their user base doubles to 20,000, they’ll likely need to invest in additional server capacity, incurring a step increase in their hosting costs.
- Retail: A retail store in Newmarket might have sufficient storage space within its current premises for its current sales volume. However, if sales significantly increase, requiring them to hold more inventory, they might need to rent additional storage space, leading to a step-up in their storage costs.
Pros of understanding Relevant Range and Step Costs:
- More accurate cost predictions: Recognizing the limitations of the relevant range and anticipating step cost increases allows for more precise budgeting and forecasting.
- Better capacity planning: Understanding capacity constraints and associated step cost triggers helps businesses optimize resource allocation and avoid bottlenecks.
- Improved long-term budgeting: Incorporating step costs and relevant ranges into long-term financial plans improves the accuracy and reliability of projections.
Cons of incorporating Relevant Range and Step Costs:
- Adds complexity to cost analysis: Requires more in-depth analysis and understanding of cost drivers.
- Requires detailed activity monitoring: Businesses need to track activity levels closely to anticipate approaching step cost thresholds.
Tips for Auckland Businesses:
- Identify capacity constraints early: Be aware of the limitations of your current resources and anticipate when step costs might be triggered.
- Monitor approaching step cost thresholds: Regularly review your activity levels and cost drivers to prepare for potential step cost increases.
- Plan for step cost increases in budgets: Allocate funds for anticipated step cost increases to avoid financial surprises.
- Consider alternative capacity solutions: Explore options like outsourcing, flexible staffing, or cloud-based solutions to manage step costs effectively.
By understanding the nuances of the relevant range and step costs, small businesses in Auckland can move beyond simplified cost analyses, gain a more realistic understanding of their financial dynamics, and make more informed decisions that contribute to sustainable growth and profitability.
Fixed vs Variable Costs: Key Concept Comparison
| Concept | Implementation Complexity 🔄 | Resource Requirements ⚡ | Expected Outcomes 📊 | Ideal Use Cases 💡 | Key Advantages ⭐ |
|---|---|---|---|---|---|
| Cost Behavior and Classification | Moderate: Requires ongoing classification and review | Moderate: Time and data collection needed | Improved budgeting, forecasting, pricing insight | Businesses managing mixed cost types across operations | Enables accurate financial forecasting and budgeting |
| Break-Even Analysis | Low: Simple formulas and graphical methods | Low: Basic calculation tools required | Identifies sales volume to cover costs | Pricing decisions, new product launch evaluation | Quick decision-making and sales target setting |
| Operating Leverage | Moderate: Calculation of leverage ratios and monitoring | Moderate to High: Detailed cost data needed | Amplified profit/loss sensitivity | Capital-intensive industries, scaling businesses | Significant profit potential and competitive advantage |
| Contribution Margin Analysis | Low to Moderate: Straightforward calculations | Low: Sales and variable cost data required | Clear product profitability insights | Pricing strategies, product mix optimization | Simplifies pricing and resource allocation decisions |
| Cost Structure Strategy | High: Strategic planning and forecasting complexities | High: Involves deep market and financial analysis | Optimized risk-return, aligns with strategy | Business model design, market positioning | Aligns costs with business strategy and competitive edge |
| Relevant Range and Step Costs | High: Requires advanced monitoring and frequent updates | High: Detailed activity and capacity data | More accurate cost and capacity planning | Capacity expansion, large-scale operational planning | Improves long-term budgeting and decision-making accuracy |
Taking Control of Your Cost Structure
Understanding the difference between fixed and variable costs is crucial for any business, especially for small businesses in Auckland facing a competitive market. This article has explored key concepts like cost behavior, break-even analysis, operating leverage, contribution margin, strategic cost structure management, and the impact of relevant range and step costs. By grasping these principles, you can gain a clearer picture of your business’s financial landscape. Mastering the difference between fixed and variable costs allows you to make informed decisions regarding pricing, production volume, and overall profitability. This knowledge empowers you to not only weather economic fluctuations but also to identify opportunities for growth and expansion.
The most important takeaway is this: actively managing your cost structure is essential for long-term success. By analyzing your fixed and variable costs, you can pinpoint areas for potential savings, optimize your pricing strategies, and ultimately boost your bottom line. This understanding helps you plan for the future, make data-driven decisions, and build a more resilient and profitable business.
Ready to take your Auckland business to the next level? Business Like NZ Ltd specializes in helping businesses understand and optimize their cost structures, leveraging the power of knowing the difference between fixed and variable costs to drive profitability. Visit Business Like NZ Ltd today for a free consultation and discover how we can help you achieve your financial goals.