
Calculating GST NZ: Essential Tips for Accurate Compliance
September 10, 2025
How to Negotiate with Suppliers: Top Strategies for Success
September 20, 2025
Why Financial Reports Matter More Than Ever

If you’re looking for guidance on reading financial reports for dummies, you’ll find it here. Financial reports can seem intimidating but let’s not embrace the ‘dumb’ tag. Many people assume they are only for financial professionals. But understanding these reports is now more important than ever, especially for individual investors. Several factors contribute to this, including easier access to investment opportunities and the increasing need to make sound financial choices.
The rise of online brokerage platforms, for example, has empowered individuals to manage their investments, requiring more advanced financial literacy. This also means relying solely on financial advisors is no longer enough. Individuals must now learn to analyze financial information themselves.
The Rise of Retail Investors and the Need for Financial Literacy
The investment world has changed dramatically. Retail investors now hold significant market share, influencing stock prices and company valuations. The growth of side hustles and small businesses also demands greater financial understanding for sustained growth and success.
This increased participation in financial markets highlights a greater need for financial literacy. In particular, reading and interpreting financial reports is now a critical skill for anyone looking to manage their wealth effectively. This isn’t just about making money; it’s also about avoiding potential losses.
Global equity market capitalization has grown tremendously, rising from about $23 trillion in 2000 to over $120 trillion in 2023. This expansion highlights the growing participation in financial markets, further emphasizing the need for improved financial understanding. More than 60% of individual investors in developed markets now see annual and quarterly reports as essential reading before making investment decisions. You can learn more about financial statements here: How To Read Financial Statements. This shows a growing awareness of the value of financial reports among investors.
Protecting Your Portfolio with Financial Knowledge
Reading financial reports is more than just understanding the numbers; it’s about understanding the story they tell. These reports can reveal potential warnings that a casual observer might miss. For example, key financial ratios like return on equity (ROE), price-to-earnings (P/E) ratio, and debt-to-equity ratio can help you assess a company’s profitability, valuation, and financial health.
Globally, an ROE above 15% is often seen as a positive indicator. By learning how to interpret these indicators, investors can make smarter decisions and potentially avoid significant losses. This empowers individuals to take control of their finances and make choices aligned with their long-term goals.
Breaking Down The Four Essential Financial Statements
Think of financial statements as a company’s regular financial health checkup. Each statement provides a different, yet interconnected, perspective on the company’s performance. For those new to navigating financial reports, let’s break down the four core statements: the balance sheet, the income statement, the cash flow statement, and the statement of shareholders’ equity.
The Balance Sheet: A Snapshot of Your Finances
The balance sheet offers a snapshot of a company’s financial position at a specific moment in time. It’s built on the fundamental accounting equation: Assets = Liabilities + Equity. Assets represent what the company owns, such as cash, inventory, and equipment. Liabilities reflect what the company owes to others, like loans and accounts payable. Equity represents the owners’ stake in the company. This statement helps assess a company’s liquidity and how it’s financed.
See: Understanding the Balance Sheet and Why It’s Important
The Income Statement: Profitability Over Time
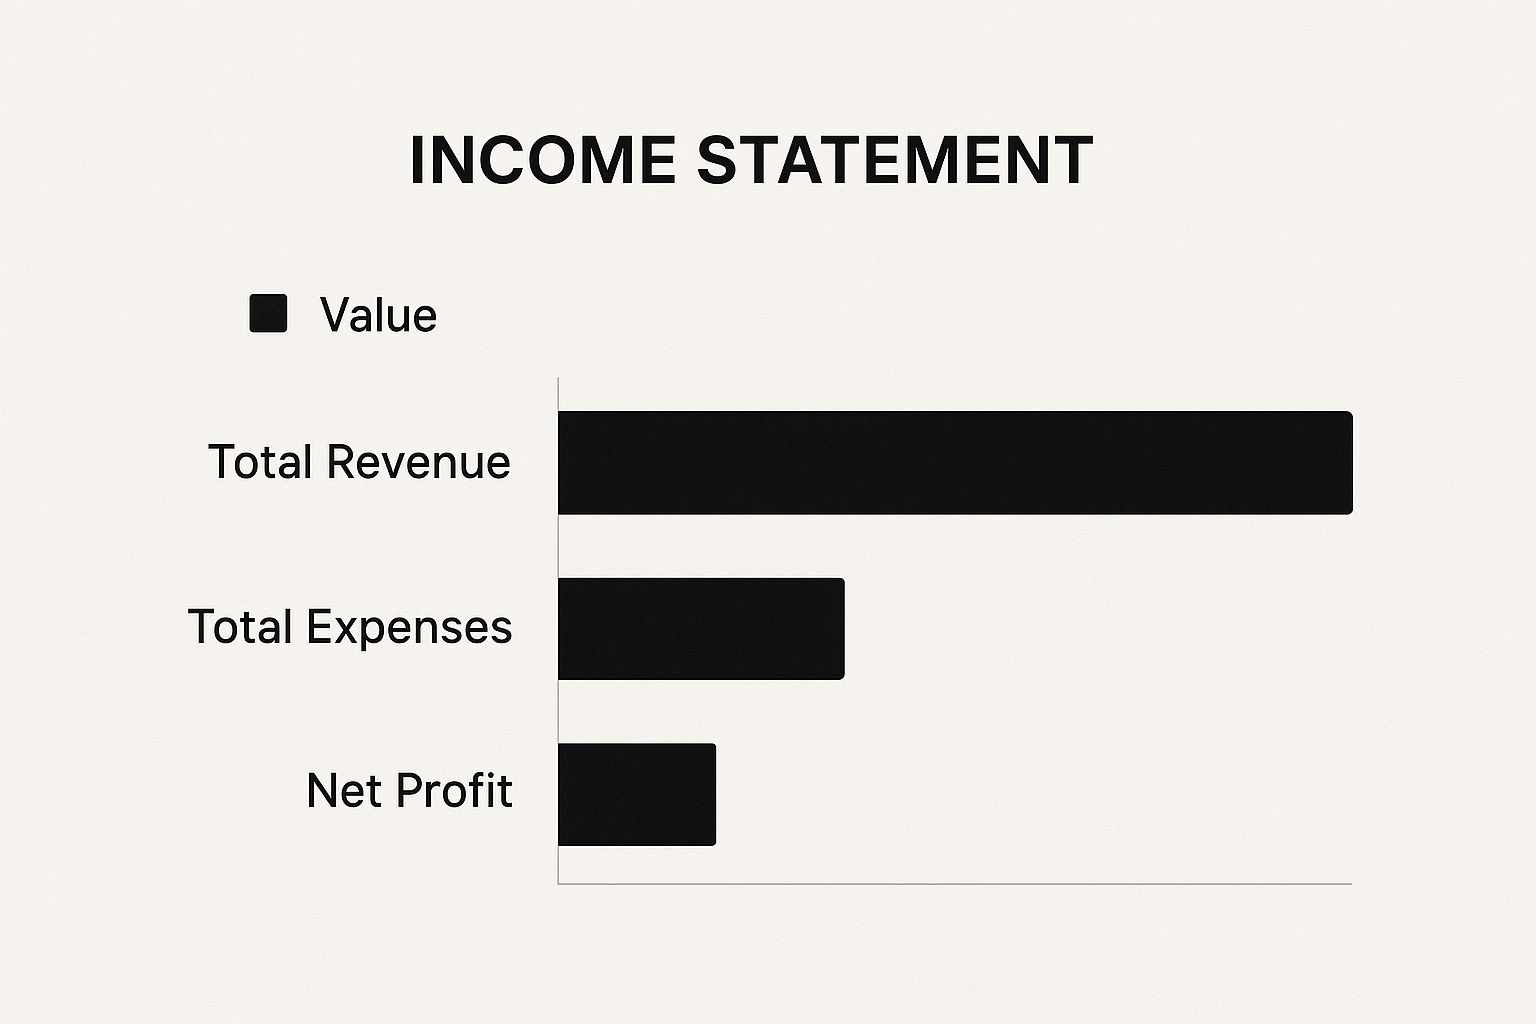
The income statement, also known as the profit and loss (P&L) statement, reveals a company’s financial performance over a defined period. It details revenues, expenses, and the resulting net income (profit or loss). This statement helps you determine the profitability of a company’s core business operations.
The Cash Flow Statement: Following the Money
While the income statement shows profitability, the cash flow statement tracks the actual movement of cash both in and out of the company. It categorizes cash flow into three key activities: operating activities (day-to-day business operations), investing activities (purchase and sale of assets), and financing activities (debt and equity transactions). This statement is essential for understanding a company’s cash management practices.
The Statement of Shareholders’ Equity: Tracking Ownership
The statement of shareholders’ equity tracks changes in the owners’ stake in the company over a specific period. Key elements include changes in retained earnings (profits reinvested in the business), share issuances, and dividend payments. This statement offers insights into how a company uses its profits and manages its ownership structure.
To help summarize these four important financial statements, let’s look at the table below:
The Four Financial Statements Comparison: A comprehensive comparison of what each financial statement shows, when to use it, and key metrics to focus on.
| Statement Type | Purpose | Time Period | Key Information | Best Used For |
|---|---|---|---|---|
| Balance Sheet | Shows a company’s financial position | Specific point in time | Assets, liabilities, equity | Assessing financial health, liquidity, and capital structure |
| Income Statement | Shows a company’s financial performance | Period of time (e.g., quarter, year) | Revenues, expenses, net income | Evaluating profitability |
| Cash Flow Statement | Shows the movement of cash | Period of time (e.g., quarter, year) | Cash flow from operating, investing, and financing activities | Understanding cash management |
| Statement of Shareholders’ Equity | Shows changes in owners’ equity | Period of time (e.g., quarter, year) | Retained earnings, stock issuances, dividends | Tracking ownership changes |
Understanding financial statements is vital for making sound investment decisions. They offer a comprehensive picture of a company’s financial health. You can learn more about financial statements here.
Mastering Balance Sheet Analysis Like A Professional

The balance sheet offers a snapshot of a company’s financial health at a specific moment. It’s like a financial X-ray, revealing the inner workings of a company’s finances. For those new to financial reports, understanding balance sheet analysis is key to smart investing. This involves grasping the fundamental accounting equation and recognizing potential warning signs.
Decoding the Accounting Equation
At the heart of every balance sheet lies the fundamental accounting equation: Assets = Liabilities + Equity. This equation forms the basis of double-entry bookkeeping. Assets represent what a company owns, its resources. These include cash, inventory, and equipment. For example, a company-owned building is considered an asset.
Liabilities, on the other hand, represent what a company owes to others. This can include loans, accounts payable, and deferred revenue. If a company takes out a loan, that loan becomes a liability. Finally, Equity represents the owners’ stake in the company. It’s the residual value of assets after all liabilities have been deducted. Think of it as what would be left for the owners if all debts were paid off.
Spotting Red Flags and Assessing Financial Strength
Professional investors use balance sheets to identify potential issues. Asset quality is a key area of focus. Investors want to know if the assets are truly valuable or if their worth is overstated. Another crucial area is debt levels. High levels of debt, particularly in relation to equity, can indicate financial instability.
A high debt-to-equity ratio, for instance, might suggest the company relies too heavily on borrowed funds. A company burdened with excessive debt may struggle to meet its financial obligations, especially during economic downturns. Conversely, a healthy equity position typically suggests a stronger financial foundation.
Analyzing Liquidity and Capital Structure
Analyzing the balance sheet is essential for assessing a company’s ability to withstand financial challenges. Liquidity, the ability to cover short-term liabilities with readily available assets, is a critical factor. The balance sheet reveals whether a company has enough liquid assets on hand.
The balance sheet also provides insights into a company’s long-term financial stability by examining its capital structure. This refers to the mix of debt and equity used to finance operations. By analyzing these elements, investors can differentiate between companies with robust financial health and those potentially facing difficulties.
Understanding Different Types of Assets and Debt
It’s important to remember that not all assets are created equal. Some assets, like cash, are highly liquid, meaning they can be quickly converted into cash. Others, like property, plant, and equipment (PP&E), are less liquid. Similarly, not all debt is necessarily bad. Some debt, such as long-term debt used for strategic investments, can fuel business growth.
However, excessive short-term debt can strain a company’s cash flow and amplify financial risk. By understanding these different categories, investors gain a deeper understanding of how effectively a company manages its resources and finances its operations. This analysis helps determine whether a company can meet its financial obligations, navigate economic downturns, and invest in future growth.
Understanding Income Statements and Real Profitability
A common misconception for those new to financial reports is that revenue equals profit. While revenue is important, it doesn’t tell the whole story. A company can have high revenue but still be unprofitable, or worse, unsustainable in the long run. The income statement helps clarify this distinction. It shows the complete financial picture, from initial sales all the way to the final profit or loss. This statement is key to understanding a company’s true profitability and its potential for long-term success.
Decoding Revenue, Costs, and Expenses
The income statement walks you through each financial step of a company’s operations. It separates costs (directly related to producing goods or services) from expenses (associated with running the business). For example, the cost of raw materials for a manufacturer would be listed separately from the salaries of administrative staff. This detailed breakdown provides a much more complete picture of a company’s performance than simply looking at the top-line revenue number.
Analyzing these individual line items helps differentiate between sustainable earnings and one-time gains. Sustainable earnings are profits generated from the core business operations. One-time gains, on the other hand, might come from something like selling off an asset. This is an essential difference for long-term investors. Companies consistently earning money from their core business are generally viewed as more financially stable than those relying on infrequent windfalls. Read also: How to master your P&L statement.
Identifying Real Profitability vs. Accounting Tricks
Understanding income statements allows you to identify companies genuinely earning money from their core business versus those using accounting tactics to appear more profitable. This involves recognizing when a company might be manipulating its numbers, even if those manipulations are within legal accounting practices.
For instance, a company could aggressively report revenue before it’s actually earned or delay recording expenses to make short-term results look better. These tactics can hide underlying problems and mislead investors. A solid understanding of the income statement helps you see through these kinds of maneuvers.
Evaluating Profitability Trends
The income statement is also a powerful tool for evaluating a company’s profitability trends over time. This gives you insight into whether profitability is improving, declining, or remaining stagnant. Key metrics to examine include gross profit margin, operating profit margin, and net profit margin.
Furthermore, understanding income statements can reveal why seemingly profitable companies might be headed for trouble. For instance, a company may report growing profits but have declining cash flow because it’s extending too much credit to customers. Alternatively, a company might reinvest all its profits back into the business, which results in lower net income in the short term but can contribute to sustainable growth in the long run. These insights are critical for assessing a company’s overall financial health, which goes beyond simply looking at the reported profit figure.
Following The Money Through Cash Flow Statements

Cash flow is essential for every business. The income statement shows profit, but the cash flow statement reveals the actual cash movement. This gives a better understanding of the company’s financial health. It shows if a company has enough cash for operations. This is important for beginners analyzing financial reports.
This often-overlooked statement can reveal hidden problems. It shows if a company actually generates cash or relies on borrowing and selling assets.
Three Key Types of Cash Flow
The cash flow statement has three main categories: operating activities, investing activities, and financing activities. Understanding each is key to assessing a company’s financial strength and strategy.
- Operating Activities: This section tracks cash from day-to-day business operations, like sales and expenses. Cash from customers and cash paid to suppliers are examples. Strong positive cash flow here is a good sign.
- Investing Activities: This section tracks investment-related cash. Buying long-term assets, like equipment or property, are cash outflows. Selling these assets creates cash inflows. This shows the company’s investment strategy.
- Financing Activities: This section shows how a company raises capital. Borrowing money is a cash inflow, while loan repayment is an outflow. Issuing stock brings in cash, while repurchasing stock or paying dividends uses it. This reveals how a company funds its growth.
Identifying Cash-Generating Businesses
Reading cash flow statements helps you find companies generating cash from their core business. A company with consistently positive cash flow from operations is usually healthier than one relying on borrowing or selling assets.
For example, negative operating cash flow but positive financing cash flow is a potential warning sign. It might mean the company depends on debt, which isn’t sustainable. This analysis helps spot risky investments.
Why Cash Flow Matters More Than Profit
Real-world examples show why some profitable companies fail. They may have high profits, but if they can’t convert profits to cash, they struggle. Businesses with strong positive cash flow can survive tough times, even with lower profit margins. Analyzing financial reports isn’t just about profits, it’s about understanding a company’s cash position. Cash keeps a business going.
Essential Financial Ratios That Reveal The Truth
Financial reports can be daunting with their raw numbers. But financial ratios offer valuable context, transforming these numbers into actionable insights. They provide a deeper understanding of a company’s performance, stability, and competitive edge, which is essential for anyone learning to interpret financial statements.
Profitability Ratios: Measuring Efficiency and Return
Profitability ratios show how efficiently a company generates profit. Key metrics include return on equity (ROE) and profit margins. ROE indicates how effectively a company uses shareholder investments. Profit margins, on the other hand, measure the percentage of revenue that becomes profit. A high ROE, for example, suggests a good return for investors.
Liquidity Ratios: Assessing Short-Term Stability
Profitability isn’t the only measure of success. Liquidity ratios assess a company’s ability to meet short-term financial obligations. These are crucial for evaluating a company’s capacity to handle immediate financial challenges. A healthy current ratio, for instance, indicates sufficient assets to cover current liabilities.
Using Industry Benchmarks For Deeper Analysis
Understanding individual ratios is only part of the picture. Industry benchmarks provide comparative data, allowing you to see how a company performs against its competitors. By comparing a company’s ratios to industry averages, you can identify its relative strengths and weaknesses within its sector. This comparative analysis is essential for informed investment decisions.
To help you understand and utilize key financial ratios, here’s a practical guide:
Essential Financial Ratios Reference Guide: A practical reference showing key financial ratios, their formulas, what they measure, and healthy benchmarks for different industries.
| Ratio Name | Formula | What It Measures | Good Range | Industry Considerations |
|---|---|---|---|---|
| Current Ratio | Current Assets / Current Liabilities | Short-term liquidity | 1.5 – 2.0 | Higher ratios may be desirable in cyclical industries |
| Quick Ratio | (Current Assets – Inventory) / Current Liabilities | Short-term liquidity excluding inventory | 1.0 – 1.5 | More relevant for companies with slow-moving inventory |
| Return on Equity (ROE) | Net Income / Shareholder Equity | Profitability relative to shareholder investment | 15% – 20% | Varies significantly by industry and growth stage |
| Profit Margin | Net Income / Revenue | Percentage of revenue that translates into profit | Varies greatly | Higher margins typically indicate stronger pricing power |
| Debt-to-Equity Ratio | Total Debt / Shareholder Equity | Proportion of financing from debt vs. equity | Varies greatly | Higher ratios indicate greater financial leverage and risk |
This table provides a starting point for analyzing financial ratios. Remember to consider industry-specific factors when evaluating these metrics.
Avoiding Common Ratio Analysis Mistakes
Interpreting financial ratios can be tricky, and beginners often make mistakes. One common error is focusing on a single ratio in isolation. For example, a high debt-to-equity ratio might be acceptable in a capital-intensive industry but concerning in another.
Another pitfall is ignoring trends over time. Analyzing how ratios change over several periods often provides more insight than a single snapshot. For instance, consistently improving profitability ratios suggests positive momentum. A comprehensive analysis involves combining multiple ratios and considering trends for a complete understanding of a company’s financial health.
By avoiding these common mistakes and utilizing a comprehensive approach, you can effectively use financial ratios to gain a true understanding of a company’s financial position.
Key Takeaways
Reading financial reports can feel overwhelming, but it doesn’t have to be. With a structured approach, anyone can unlock the valuable information these documents hold. This section provides a practical guide to confidently analyze financial statements, emphasizing actionable steps, key questions, and warning signs to watch out for.
Developing Your Investment Screening Criteria
Creating personalized investment screening criteria is essential for investment success. This means defining your risk tolerance, investment goals, and preferred industries. By setting clear boundaries, you can focus on companies that match your financial objectives and avoid making rash decisions.
- Define Your Risk Tolerance: Are you comfortable with high-growth, high-risk investments, or do you prefer stable, low-risk options? Your comfort level with potential losses should guide your choices.
- Establish Investment Goals: What are you hoping to achieve with your investments? Long-term growth? Short-term gains? Clearly defined goals will help you select appropriate investment strategies.
- Identify Preferred Industries: Are you interested in specific sectors like technology, healthcare, or renewable energy? Focusing on familiar industries can simplify your analysis.
Building a Repeatable Process
Analyzing financial reports requires a consistent, repeatable process. This structured method ensures you consider all the essentials and reduces the risk of missing critical details.
- Start with the Big Picture: What metrics are important to get an overview of the company’s performance?
- Dive into the Statements: Systematically analyze the balance sheet, income statement, and cash flow statement. Look for trends and anything that seems inconsistent.
- Calculate Key Ratios: Use financial ratios like the debt-to-equity ratio to assess profitability, liquidity, and solvency. Understanding customer acquisition is also helpful. For more details, check out how to calculate Customer Acquisition Cost.
- Compare with Competitors: Benchmark the company’s performance against its competitors to understand its relative strengths and weaknesses.
Avoiding Common Mistakes
New investors often make common errors when reading financial reports. Knowing these pitfalls can help you avoid expensive mistakes.
- Ignoring Cash Flow: A company may report profits but have negative cash flow. Cash is crucial, making it essential to focus on the cash flow statement.
- Overlooking Debt Levels: High debt levels can strain a company’s finances and increase its vulnerability during economic downturns.
- Relying Solely on Past Performance: Past performance is not a guarantee of future success. Consider the company’s future outlook, industry trends, and the competitive landscape.
Recommended Tools and Practice
Various resources can improve your financial report analysis skills.
- Financial News Websites: Stay informed about market news and company announcements.
- Investment Research Platforms: Access detailed company analysis, financial data, and expert opinions.
Regular practice is key to mastering financial statement analysis. Start with companies you know and gradually broaden your knowledge.
Realistic Expectations
Developing expertise in reading financial reports takes time and dedication. Don’t expect to become an expert overnight. Be patient, stay persistent, and acknowledge your progress along the way. Building this skill is a valuable, lifelong journey that can significantly improve your investment decisions.
Want expert help navigating your business finances? Business Like NZ Ltd offers tailored accounting and advisory services for small to medium businesses in Auckland, helping you achieve financial freedom.


