
Understanding When You Can Claim Food as a Business Expense
July 5, 2025
Managing Shareholder Current Accounts: What Every Business Owner Needs to Know
July 15, 2025
Breaking Down the Break-Even Concept
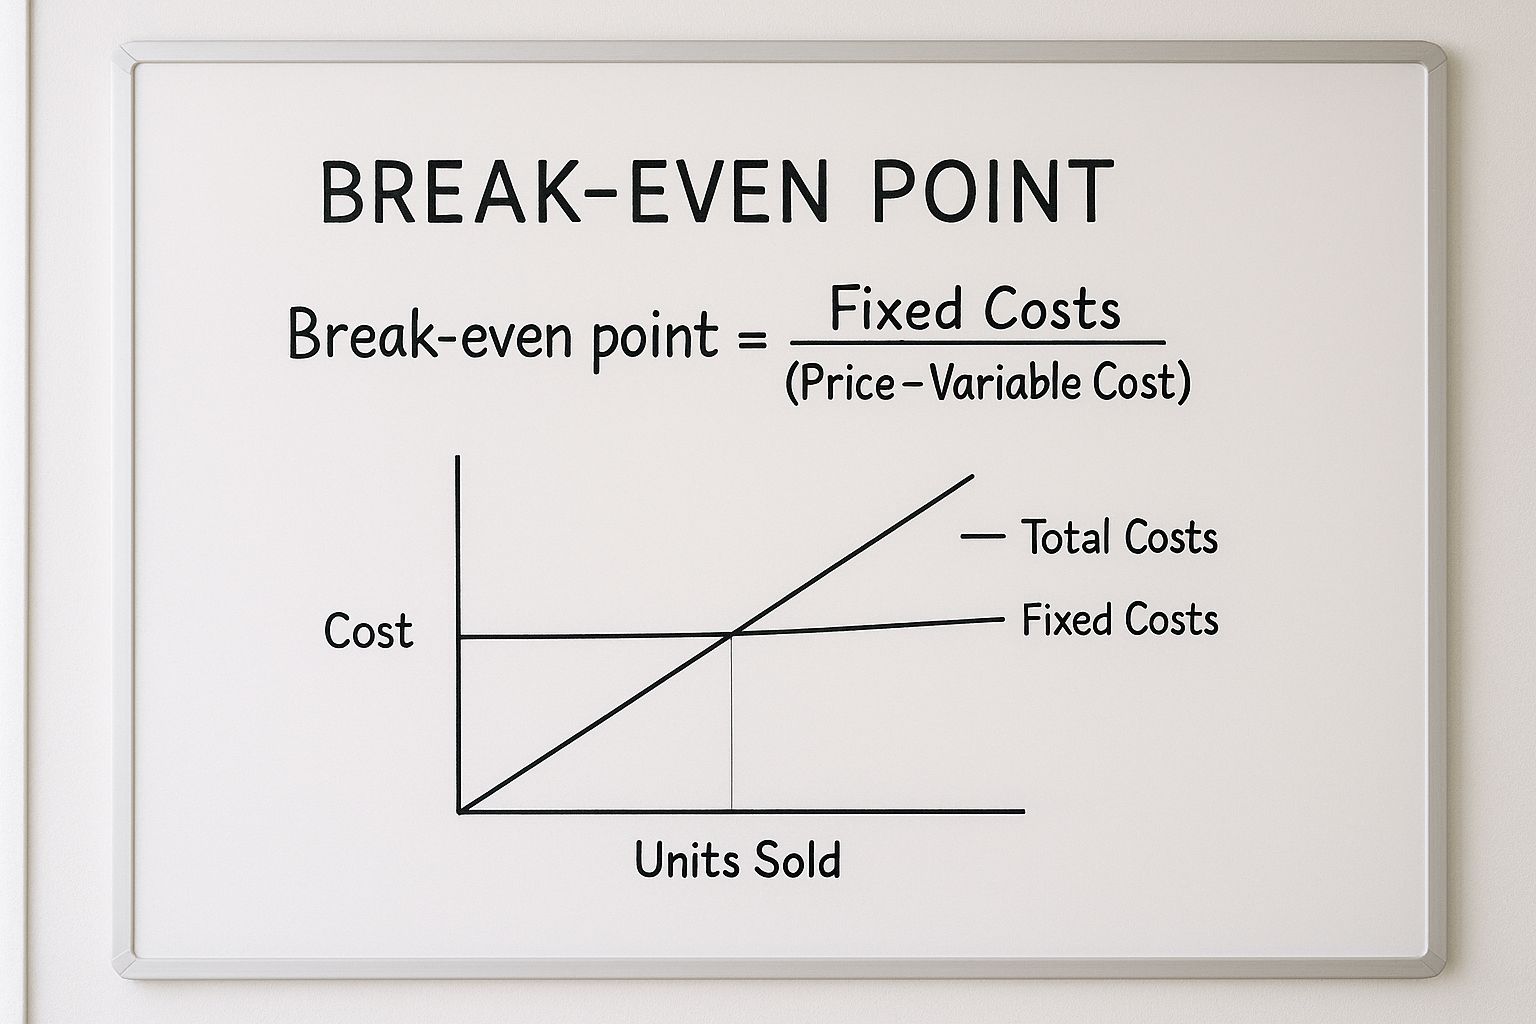
Understanding your business’s profitability is crucial. A key concept is the break-even point: where total revenue equals total costs. This signifies the shift from loss to profit. Knowing your break-even point is fundamental for planning, influencing pricing and expansion. It provides essential financial clarity for navigating the market. Understanding this isn’t just for accountants; it’s vital for every entrepreneur.
Why the Break-Even Point Matters
The break-even point isn’t just about avoiding losses; it’s a foundation for sustainable growth. Imagine launching a new product. Your break-even point helps determine the minimum units you need to sell to cover your investment and expenses. It also helps set realistic sales targets and informs decisions about pricing and resources. This knowledge allows proactive adjustments, keeping your business profitable.
Calculating the Break-Even Point: The Fundamentals
Calculating the break-even point requires understanding your costs: fixed costs and variable costs. Fixed costs (like rent or salaries) remain constant, regardless of production. Variable costs (like raw materials or packaging) change with production. To calculate your break-even point, you need your contribution margin: the difference between selling price and variable cost per unit. Calculating the break-even point involves dividing fixed costs by the contribution margin.
For example, a company with $2 million in fixed costs, variable cost per unit of $2.50, and selling price of $6.50, has a contribution margin of $4 per unit. This results in a break-even point of 500,000 units. With a contribution margin ratio of 61.5% (contribution margin divided by selling price), the break-even point in dollars is $3.25 million. This demonstrates how analysis provides metrics for planning. Using these metrics, companies can adjust pricing or production to reach profitability faster.
Learn more about break-even analysis here: Break-Even Point (BEP)
Identifying Your Crucial Cost Components
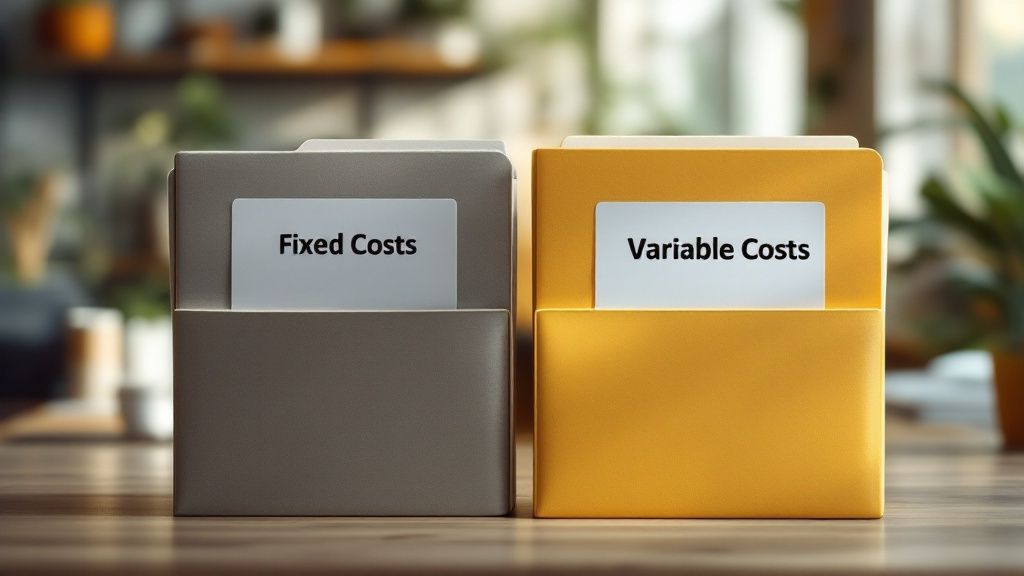
Before you can calculate your break-even point, you need a firm grasp of your costs. This means understanding the crucial difference between fixed costs and variable costs. Misclassifying these costs can lead to inaccurate break-even calculations, which can ultimately impact your business decisions. This section will help you understand and track these cost categories.
Fixed Costs: The Constants In Your Business
Fixed costs remain the same, regardless of how much you sell. These are the expenses you pay even if you don’t sell a single product or service. Common fixed costs include rent, salaries and insurance premiums. For example, if your monthly rent is $2,000, it stays at $2,000 whether you sell 100 units or 1,000. Accurately identifying your fixed costs is the first step in calculating your break-even point.
Variable Costs: Expenses That Fluctuate
Variable costs, unlike fixed costs, change directly with your sales volume. They increase when you produce and sell more and decrease when you produce less. Typical variable costs include raw materials, packaging, and direct labor related to production. If each unit requires $5 of raw materials, your variable costs will be $500 for 100 units and $5,000 for 1,000 units. Understanding this fluctuation is essential for accurate break-even analysis.
Keeping track of variable costs allows you to see how changes in production volume affect your bottom line. This information is valuable for making production decisions and adjusting your sales strategy.
Decoding Mixed Costs: The Hybrid Expense
Some costs are not easily categorized as fixed or variable; these are mixed costs. They have both fixed and variable components. A common example is utilities. You might have a fixed monthly charge plus a variable fee based on usage. Properly allocating mixed costs is crucial for an accurate break-even analysis. One way to do this is to separate the fixed and variable components based on past data or industry standards.
By separating the fixed and variable components of mixed costs, you gain a more accurate understanding of your overall cost structure. This helps in forecasting expenses and improving the accuracy of your break-even calculations.
To better understand the differences between these cost types, let’s look at a comparison table:
Fixed vs. Variable Costs Comparison
This table compares the key characteristics of fixed and variable costs to help businesses properly categorize their expenses.
| Cost Type | Definition | Examples | Behavior with Production Changes | Impact on Break-Even |
|---|---|---|---|---|
| Fixed Costs | Remain constant regardless of production volume | Rent, Salaries, Insurance Premiums | Do not change | Directly influence the break-even point |
| Variable Costs | Change directly with production volume | Raw Materials, Packaging, Direct Labor | Increase with higher production; decrease with lower production | Influence the required sales volume to reach break-even |
| Mixed Costs | Have both fixed and variable components | Utilities (fixed monthly charge + variable usage fee) | Partially change based on the variable component | Influence the break-even point depending on the proportion of fixed and variable components |
Calculating the break-even point is a crucial step for businesses. Break-Even Point Data offers further information on this topic. For instance, using historical data, a company might find its fixed costs total $600,000 annually (including $100,000 for rent and $500,000 for salaries). With a $5 variable cost per unit and a $10 selling price, the contribution margin is $5. To break even, they must sell 120,000 units ($600,000 / $5).
Regularly Reviewing Your Costs
Successful businesses regularly review their cost structure. This helps identify areas for improvement and uncover hidden opportunities to lower costs. Consistent evaluation refines their understanding of cost components, allowing them to optimize their break-even point and maximize profitability.
How to Calculate Break Even: Three Proven Methods
Knowing your break-even point is essential for any business. It’s the point where your revenue equals your total costs, indicating neither profit nor loss. This section explores three methods for calculating your break-even point, each offering valuable insights.
Break-Even Point in Units: How Much to Sell
This method tells you how many units you need to sell to break even. The formula is: Fixed Costs / (Selling Price Per Unit – Variable Cost Per Unit). This calculation focuses on sales volume.
For example, let’s say your fixed costs are $10,000, your selling price is $50 per unit, and your variable costs are $20 per unit. Your break-even point is 333.33 units. Since you can’t sell fractions of units, you’d need to sell 334 units to cover all costs. This method is especially helpful for businesses with a single product.
Break-Even Point in Sales Dollars: Targeting Revenue
This method focuses on the revenue you need to generate to break even. The formula is: Fixed Costs / ((Selling Price Per Unit – Variable Cost Per Unit) / Selling Price Per Unit).
Using the same example, your break-even point in sales dollars would be $16,666.67. This method is useful for businesses with diverse product lines where tracking unit sales might be complex.
Break-Even Point with Desired Profit: Setting Profitability Goals
This method incorporates your profit goals into the calculation. The formula is: (Fixed Costs + Desired Profit) / (Selling Price Per Unit – Variable Cost Per Unit). This tells you the sales volume needed to reach a specific profit target.
If your target profit is $5,000, you’d need to sell 500 units (($10,000 + $5,000) / ($50 – $20)). This method is excellent for businesses focused on growth and achieving specific financial targets. Managing your costs is critical; for further insights, check out this guide on improving cash flow.
The following data chart visualizes the three break-even calculations:
| Calculation Method | Value |
|---|---|
| Break-Even Point in Units | 334 units |
| Break-Even Point in Sales Dollars | $16,667 |
| Break-Even Point with $5,000 Profit | 500 units |
The chart clearly illustrates that achieving a profit requires selling more units and generating higher revenue compared to simply breaking even.
Break-even analysis is globally applicable. Consider a retailer with $750,000 in fixed costs, a $15 selling price, and $10 variable costs. They would need to sell 150,000 items to reach their break-even point. This calculation adapts to market changes, which you can learn more about from resources like Break-Even Point Analysis.
Understanding these calculations empowers businesses to make informed decisions about pricing, production, and expansion. To further illustrate different approaches, the table below compares break-even calculation methods:
Break-Even Calculation Methods
| Calculation Method | Formula | When to Use | Advantages | Limitations |
|---|---|---|---|---|
| Units | Fixed Costs / (Selling Price Per Unit – Variable Cost Per Unit) | Single product businesses focused on sales volume | Simple to understand and calculate | Less useful for businesses with multiple products |
| Sales Dollars | Fixed Costs / ((Selling Price Per Unit – Variable Cost Per Unit) / Selling Price Per Unit) | Businesses with diverse product lines or focusing on overall revenue | Useful when unit sales are complex to track | Requires accurate pricing and cost data |
| Desired Profit | (Fixed Costs + Desired Profit) / (Selling Price Per Unit – Variable Cost Per Unit) | Businesses aiming for specific profit targets | Helps plan for growth and profitability | Requires accurate profit projections |
This table summarizes the key formulas, applications, strengths, and weaknesses of each break-even calculation method, allowing businesses to select the most suitable approach for their specific needs.
Turning Numbers Into Visual Insights
Crunching the numbers to understand your break-even point is fundamental. But visualizing that data is what transforms those raw calculations into actionable business strategies. Visuals make the information more digestible, especially for team members who may not be financially savvy. Let’s explore how you can create compelling visuals to make your break-even analysis clear and impactful.
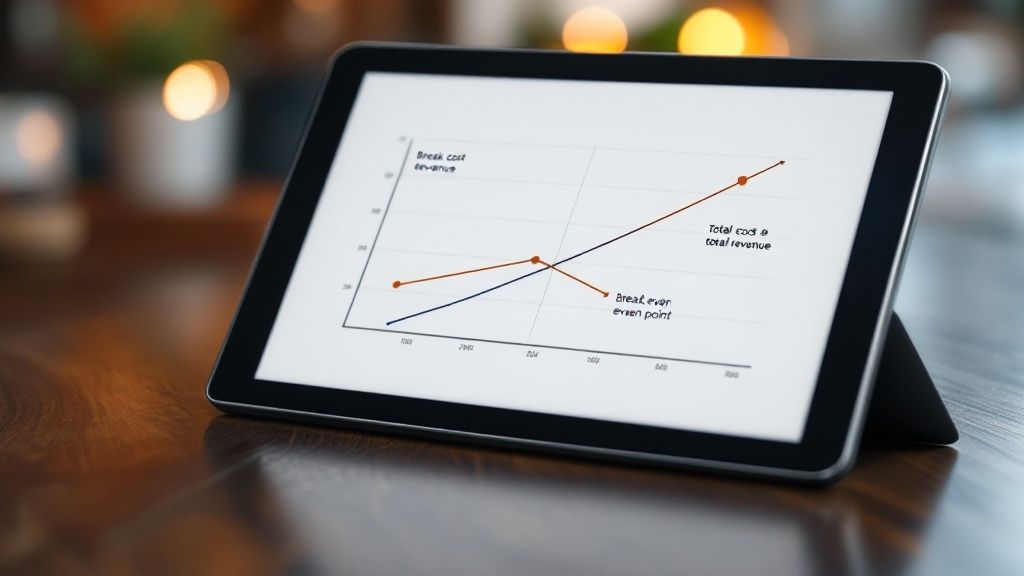
Creating Break-Even Charts: A Visual Guide to Profitability
A break-even chart is a valuable tool. It visually represents your costs, revenue, and, of course, your break-even point. It does this by plotting your total costs and total revenue against different sales volumes. The intersection of these two lines pinpoints your break-even point. Creating these charts is straightforward, whether you’re using spreadsheet software like Microsoft Excel or dedicated data visualization tools. These charts help you quickly identify your profit threshold.
For example, in Excel, you can create a simple line graph. The x-axis represents sales volume, and the y-axis shows your costs and revenue. By plotting your fixed costs, variable costs, and total revenue as separate lines, you can easily see where your total revenue surpasses total costs – that’s your break-even point.
Visualizing What-If Scenarios: Exploring Different Possibilities
Break-even charts aren’t static images. They allow you to explore dynamic what-if scenarios to understand how changes to key variables affect your profitability. Imagine instantly seeing the impact of tweaking your pricing, altering production volume, or negotiating better rates for raw materials. This dynamic approach facilitates quick, data-driven decision-making.
For instance, increasing your selling price moves your revenue line upwards, resulting in a lower break-even point. On the other hand, if the cost of raw materials rises, your total cost line shifts upwards, leading to a higher break-even point. Visualizing these changes clarifies their impact immediately.
Real-World Examples: How Businesses Use Visualizations
Many successful businesses rely on visual break-even analysis to inform their strategies. A manufacturing company might use a break-even chart to determine the ideal production volume for a new product launch. A restaurant could use it to adjust menu prices based on anticipated customer demand. These are just a few examples of how visualizing break-even data helps businesses plan effectively and make strategic decisions.
Data Visualization Tools: Enhancing Your Insights
Beyond basic spreadsheet charts, a range of powerful data visualization tools offer more sophisticated options. These tools can create interactive dashboards, allowing for real-time adjustments and more in-depth data exploration. This deeper dive gives you a more nuanced understanding of your break-even dynamics, enabling more accurate forecasting.
By using visual representations of your break-even analysis, you can transform raw data into easy-to-understand, actionable insights. These insights empower better business decisions and contribute to a more profitable bottom line.
Avoiding the Break-Even Calculation Mistakes That Cost You
Even seasoned financial professionals can sometimes make mistakes when calculating break-even points. Overlooking small details can lead to big errors, impacting important business decisions. This section highlights common pitfalls and offers practical strategies for accurate break-even analysis.
The Peril of Misclassified Expenses
One of the most frequent mistakes is misclassifying fixed costs and variable costs. For example, some marketing expenses might seem fixed, but actually change with sales volume. This can distort the contribution margin and lead to an inaccurate break-even point. Carefully examine each expense to determine its true nature.
Unrealistic Sales Projections: A Common Trap
Another common mistake is using overly optimistic sales projections. While positive thinking is good, unrealistic sales assumptions can skew your break-even point. Base your projections on solid market research, past data, and realistic growth expectations. Overestimating sales can lead to underestimating how much you need to sell to be profitable.
Neglecting Mixed Costs: Hidden Complexity
Many businesses overlook mixed costs, treating them as entirely fixed or variable. Mixed costs have both fixed and variable components. Failing to separate these components will skew the break-even calculation. Analyze each mixed cost, carefully separating the fixed and variable portions.
Validating Your Break-Even Results: Real-World Testing
Don’t just rely on theoretical calculations. Test your break-even point against real-world data. Compare your projected break-even point with actual sales to identify discrepancies and improve accuracy. This practical validation provides valuable insights.
The Power of Sensitivity Analysis: Preparing for Change
Market conditions constantly change. Sensitivity analysis helps assess how changes in key variables, like selling price or variable costs, affect your break-even point. For example, what if material costs increase by 10%? Sensitivity analysis answers these questions, allowing you to anticipate challenges and adapt.
Addressing Unique Business Challenges: Tailoring Your Approach
Different business models face unique challenges. Seasonal businesses have fluctuating sales volumes. Service-based companies have different cost structures than product-based businesses. Multi-product operations need to consider each product’s contribution margin. Tailor your break-even analysis to reflect your specific business for a more accurate assessment of your profitability threshold.
Leveraging Your Break-Even Analysis For Growth
Calculating your break-even point isn’t a one-and-done activity. It’s a dynamic tool you can use to fuel business growth. Successful businesses regularly use break-even analysis to inform key decisions, from pricing strategies to expansion plans. Let’s explore how you can use it to achieve your business goals.
Identifying Growth Opportunities: Spotting Potential
Break-even analysis can help you identify promising growth areas. By analyzing your costs, pricing, and sales volume, you can pinpoint the products or services with the highest profit potential. For example, a product with a low break-even point and high demand presents a significant growth opportunity. This knowledge allows you to prioritize resources and concentrate on the most profitable avenues.
Evaluating Expansion Plans: Informed Decision-Making
Thinking about expanding your business? Break-even analysis is a crucial step. It helps you assess the financial viability of new ventures. By calculating the break-even point for a new product line or market entry, you can determine the feasibility of the expansion and set realistic expectations. This informed approach minimizes risks and increases your chances of success.
Optimizing Pricing Strategies: Finding The Right Balance
Pricing your products or services correctly is vital for profitability. Break-even analysis helps you find the perfect price point – one that covers your costs and generates profit. By adjusting your pricing and analyzing its impact on your break-even point, you can fine-tune your strategy for optimal revenue. This careful balance ensures you remain competitive while maximizing profitability.
Incorporating Break-Even Analysis Into Planning: Regular Reviews
Integrating break-even analysis into your regular planning processes, such as quarterly reviews and annual budgeting, is essential. Regularly revisiting your break-even point helps you stay on track and adapt to changes in your business environment. This proactive approach keeps you aware of your profitability threshold.
Setting Performance Targets: Establishing Benchmarks
Use your break-even calculations to set realistic performance targets for your team. Communicating these targets ensures everyone understands the company’s financial goals and works towards achieving them. This shared understanding fosters accountability and drives team performance.
Evaluating Investment Opportunities: Data-Driven Insights
Break-even analysis can also inform investment decisions. Whether you’re considering new equipment, software like Microsoft Office, or marketing campaigns, calculating the break-even point helps determine the potential return on investment. This data-driven approach guides investment choices and optimizes resource allocation.
Real-World Case Studies: Learning From Success
Looking at how other businesses have successfully used break-even analysis can provide valuable insights. Many companies have leveraged break-even insights to launch new products, enter new markets, and streamline operations. Learning from their experiences can help you avoid common pitfalls and adapt successful strategies for your own business.
For example, a retail store could use break-even analysis to determine the best price for a new clothing line, considering factors like the cost of goods, marketing expenses, and projected sales volume. A software company might use it to evaluate the feasibility of developing a new feature, factoring in development costs, subscription pricing, and anticipated user adoption.
By transforming your break-even analysis from a simple calculation into a powerful tool, you can boost profitability and position your business for long-term success. Want expert advice tailored to your business in Auckland? Contact Business Like NZ Ltd at for taxation and business advisory services to help you achieve financial freedom.


