Inventory Turnover Ratio Calculation
Ever wonder how quickly your products fly off the shelves and turn back into cash? That’s exactly what the inventory turnover ratio calculation tells you. It’s a surprisingly simple formula that reveals how many times you sell and restock your entire inventory over a certain period.
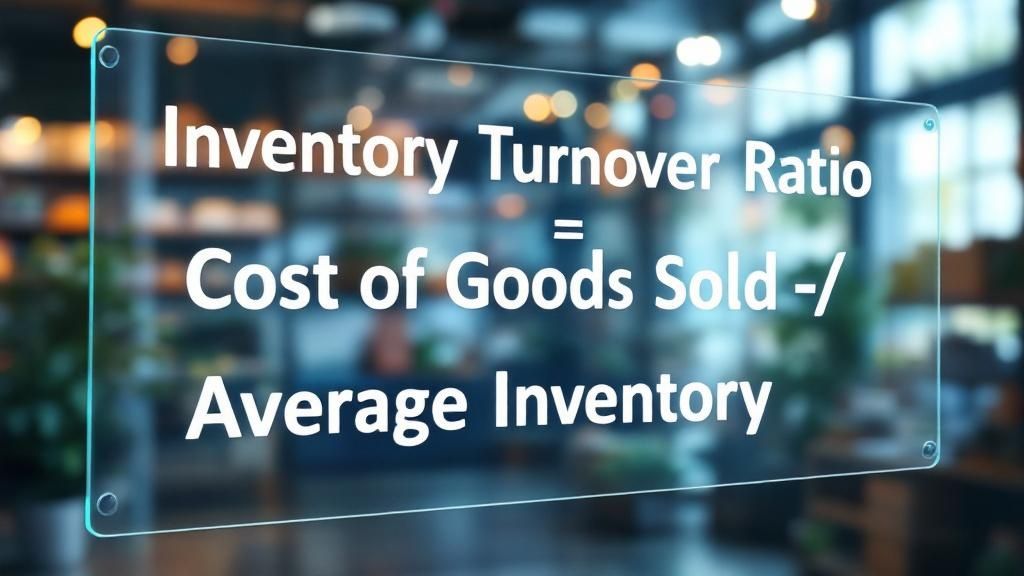
The formula itself is straightforward: Cost of Goods Sold ÷ Average Inventory. But the story it tells about your business’s health is incredibly valuable.
What the Inventory Turnover Ratio Calculation Really Tells You
Let’s be honest, financial ratios can sound a bit stuffy. But think of this one like a bakery. The owner needs to sell those fresh croissants before they get stale. Selling them fast means happy customers, a great reputation, and cash in the register. If they sit around, it’s just wasted dough—literally.
Your business isn’t so different. A high turnover rate shows you’ve got a good handle on what your customers want and you’re not tying up precious cash in products that just sit there. It directly impacts your bottom line in a few key ways:
- Cash Flow: Quicker turnover means money comes back into your business faster, ready to be reinvested.
- Storage Costs: The less time stock spends in your warehouse or back room, the less you spend on rent, insurance, and handling.
- Profitability: Selling products efficiently means you avoid losses from goods becoming obsolete, damaged, or expired.
Your Inventory Turnover Calculation Toolkit
Before you can crunch the numbers, you’ll need to gather a couple of key pieces of information from your financial statements. Think of these as the two main ingredients for your calculation.
A quick look at the two main ingredients needed for your inventory turnover ratio calculation.
| Component | What It Means for You | Where to Find the Number |
|---|---|---|
| Cost of Goods Sold (COGS) | This is the direct cost of everything you sold during the period. It includes materials, direct labor, and manufacturing overhead. | Look for it on your income statement. |
| Average Inventory | This is the average value of your inventory during that same period. It smooths out any big swings in stock levels. | Find your beginning and ending inventory on your balance sheets. Add them together and divide by two. |
With these two numbers, you have everything you need to figure out your ratio.
Key Takeaway: Don’t get lost in the jargon. This ratio is simply a measure of efficiency. A strong number proves you’re making smart purchasing decisions and selling products effectively.
For a broader understanding of this key metric, you can refer to this comprehensive guide to the Inventory Turnover Ratio.
Choosing the Right Inventory Turnover Formula
If you’ve been digging into how to calculate your inventory turnover, you’ve probably run into two different formulas. One uses your Cost of Goods Sold (COGS), and the other uses your total Sales. It’s a common point of confusion, but honestly, the choice is pretty straightforward.
For a true picture of what’s happening with your stock, the COGS-based formula is the one you want to use. It’s the gold standard. Why? Because it keeps everything on a level playing field. You’re comparing the cost of your inventory to the cost of the products you sold, without any sales markups muddying the waters.
Using your total sales figure can make your turnover ratio look much better than it actually is. Sales numbers include your profit margin, which inflates the result. This gives you a skewed view because your inventory is valued at cost on your books, not at its retail price.
COGS vs. Sales: Why There’s a Clear Winner
Think about it this way: your inventory sits on your balance sheet valued at what you paid for it. Your COGS reflects that same cost. When you compare these two cost-based figures, you get a clean, accurate measure of how efficiently you’re turning that inventory investment into cash.
But when you compare a cost figure (Average Inventory) with a retail price figure (Sales), you’re comparing apples to oranges. The math just doesn’t line up logically.
My Two Cents: Stick with the COGS formula for all your internal analysis. It gives you the real story of your operational health, helping you make smarter purchasing and stocking decisions without being misled by profit margins.
So, to run the numbers the right way, you’ll need to grab a couple of figures from your financial statements:
- Cost of Goods Sold (COGS): This number lives on your income statement. It’s the direct cost of producing the goods you’ve sold over a period.
- Average Inventory: You’ll have to calculate this one yourself. Just take your beginning inventory, add your ending inventory for the same period, and divide by two. You can pull these inventory values from your balance sheets.
Using the COGS method ensures your calculation is built on solid ground. It’s the reliable metric you need to truly gauge how well your business is managing its stock.
Your First Inventory Turnover Ratio Calculation
Alright, let’s roll up our sleeves and see how this works in the real world. Enough with the theory—it’s time to actually calculate your first inventory turnover ratio. We’ll walk through it with a simple example: a small online candle shop. This should make it crystal clear how to grab the right numbers from your own books.
First things first, our candle shop owner needs her Cost of Goods Sold (COGS) for the year. A quick look at her annual income statement shows her COGS was $50,000. Remember, this is the total direct cost of producing the candles she sold—the wax, wicks, fragrance oils, and so on.
Next up is average inventory. This sounds fancy, but it’s just the midpoint between what she started with and what she ended with. She’ll need her balance sheets for this.
- Beginning Inventory (from January 1st): $10,000
- Ending Inventory (from December 31st): $12,000
To get the average, she just adds them together ($10,000 + $12,000 = $22,000) and divides by two. That gives her an average inventory of $11,000 for the year. Easy enough.
Crunching the Numbers
Now that she has both pieces of the puzzle, the rest is just simple division. She just needs to plug those numbers into the formula.
Inventory Turnover Ratio = COGS / Average Inventory
For her candle business, it looks like this:
$50,000 / $11,000 = 4.55
So, the candle shop’s inventory turnover ratio is 4.55. In plain English, this means the business sold through and restocked its entire inventory about 4.5 times over the course of the year.
This image lays out the process visually. It’s a great little cheat sheet to keep handy.
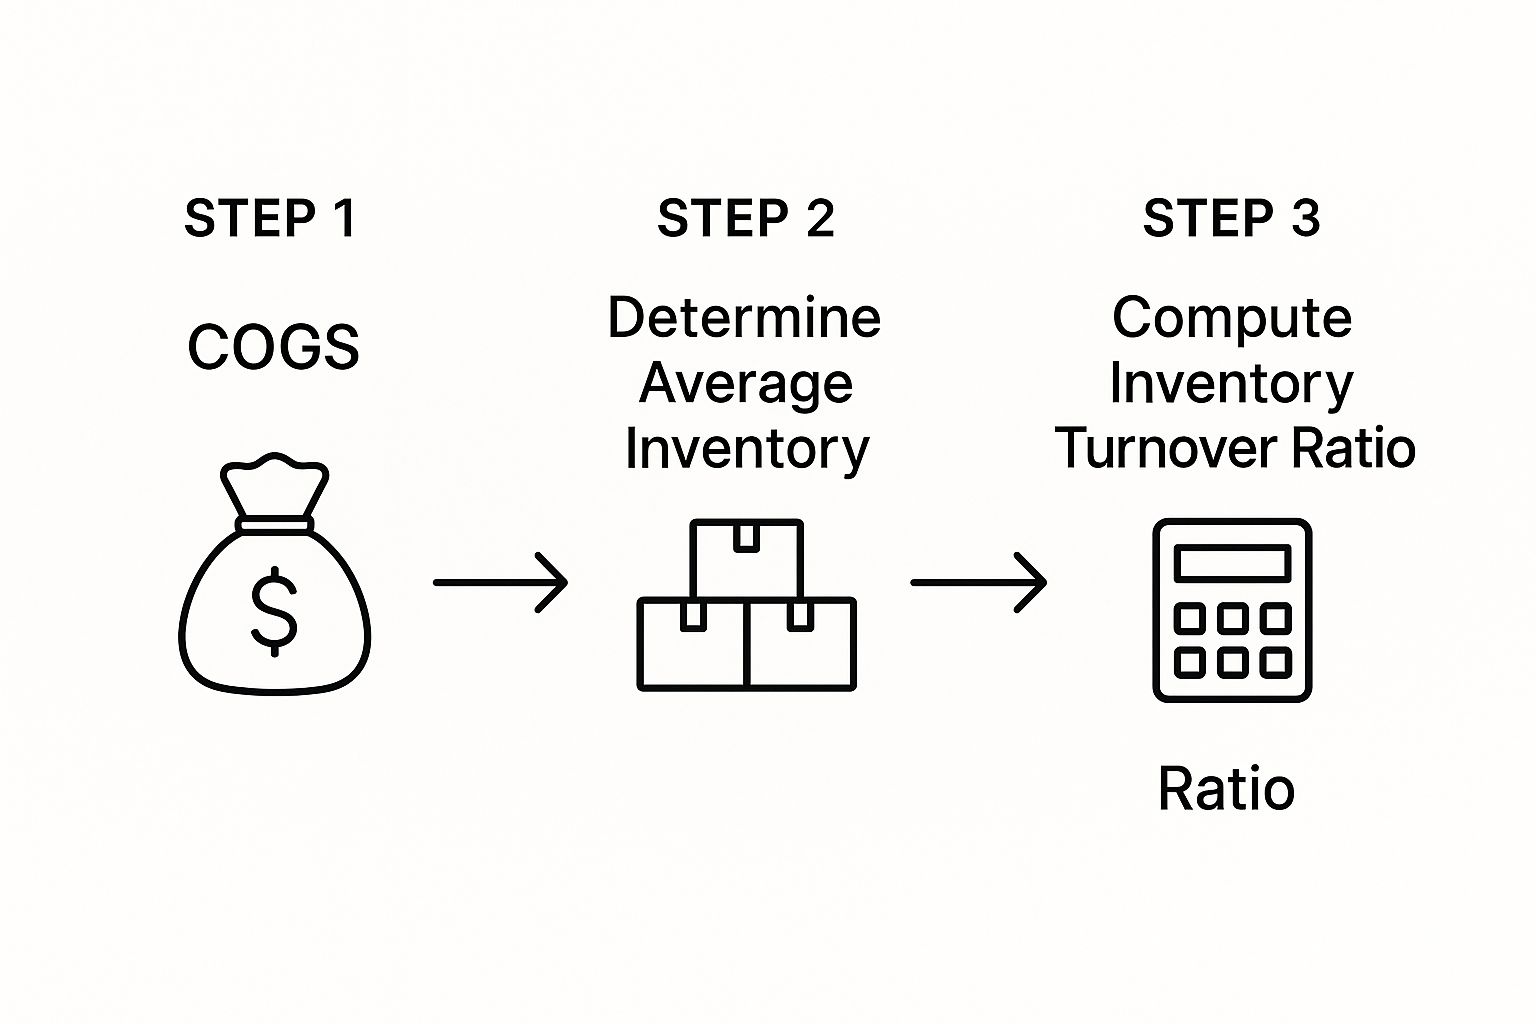
As you can see, you just gather your COGS, find your average inventory, and then do the final calculation. It’s a logical flow that gets you to a really powerful number.
My Two Cents: Don’t let the accounting terms scare you off. At the end of the day, you’re just grabbing two numbers from financial statements you probably already have and doing one simple division problem. It’s a five-minute task that delivers a huge insight into your business’s health.
This little example is the exact blueprint you can follow for your own business. If you want to dive even deeper into the nuts and bolts, this article on how to calculate inventory turnover is a fantastic resource. Now that we have our number, let’s talk about what it actually means.
Making Sense of Your Inventory Turnover Number
Okay, so you’ve crunched the numbers and have your inventory turnover ratio. Now what? The big question is always, “Is this a good number?” And the honest answer I always give clients is: it depends entirely on your industry.
Context is king here. A business selling fast-fashion t-shirts will—and should—have a super high turnover. That’s a sign of a healthy, on-trend operation. But a boutique that sells expensive, custom-made furniture? Their number will naturally be much lower, and that’s perfectly fine for their business model. Comparing the two is like comparing apples to oranges.
High Ratio vs. Low Ratio
So, what are the extremes telling you?
A high inventory turnover ratio usually signals strong sales and smart inventory management. Your products are flying off the shelves, which is fantastic for your cash flow. But be careful. If the ratio creeps too high, it might be a warning sign. You could be running too lean, risking stockouts, and ultimately losing sales and frustrating loyal customers.
On the flip side, a low inventory turnover ratio can mean a couple of things, neither of them great. It often points to weak sales or—more commonly—overstocking. This means your cash is literally sitting on a shelf collecting dust instead of working for you. It also racks up holding costs like storage, insurance, and the risk of the product becoming obsolete.
Key Insight: Neither a high nor a low ratio is inherently good or bad on its own. The real goal is to find that “Goldilocks” number for your business—the sweet spot that keeps sales humming without risking stockouts or tying up too much capital in slow-moving inventory.
Finding Your Industry Benchmark
To get a real feel for your performance, you need to see how you stack up against others in your field. This gives you a realistic benchmark and helps you set goals that make sense.
For example, data from 2024 showed the average turnover ratio across all industries was 8.5. But when you dig in, you see huge differences. Retail businesses averaged closer to 11.32, while technology companies sat around 7.84. This is exactly why you can’t compare your candle shop’s performance to a car dealership’s. If you want to dive deeper into the numbers, these inventory management statistics are a great resource.
Industry Snapshot: Inventory Turnover Ratios
See how average inventory turnover ratios vary across different sectors. Use this as a general guide to see where your business might fit.
| Industry | Average Turnover Ratio | What It Suggests |
|---|---|---|
| Retail (General) | 11.32 | Fast-moving goods and consistent consumer demand. |
| Technology | 7.84 | Steady sales but longer product lifecycles than retail. |
| Capital Goods | 2.67 | High-value, low-volume sales with long sales cycles. |
Looking at a table like this makes it clear that a “good” number is relative. Your job is to understand where you fit and work toward the optimal ratio for your specific niche.
Practical Ways to Improve Your Inventory Turnover
Alright, you’ve got your inventory turnover ratio. Now what? Knowing the number is one thing, but actually improving it is where you’ll see a real impact on your cash flow. A better ratio means more money in your bank account and less tied up in products gathering dust on your shelves.
Think of it this way: every item that sits unsold isn’t just taking up physical space. It’s actively costing you money in storage fees and represents a missed opportunity to invest in something that would sell. The goal here is simple: get your products moving.
A fantastic starting point is getting better at demand forecasting. Dive into your sales history. What sells like crazy during the holidays? What about seasonal shifts? If you know you sell twice as many woolly hats in winter, you can order accordingly instead of just winging it. This is especially crucial for businesses with big seasonal swings. You can find some great ideas for maximising profitability and cash flow for seasonal businesses.
Smart Strategies for Small Businesses
You don’t need a huge budget to make a real difference. Here are a few things that have worked for countless businesses I’ve seen:
- Get Creative with Slow Movers: Got some products that just won’t budge? Don’t let them become permanent fixtures. Use promotional pricing or create product bundles to make them more appealing. A “buy one, get one half off” deal can clear out old stock and free up cash for inventory people are clamoring for.
- Try a ‘Just-In-Time’ Approach: This sounds more complex than it is. A simplified ‘Just-In-Time’ (JIT) system just means ordering smaller amounts of inventory more often. Instead of one massive order that sits for months, you get stock delivered closer to when you’ll actually sell it. This slashes your holding costs and minimizes the risk of getting stuck with things you can’t sell.
Pro Tip: You can learn a lot by watching the big players. Take Walmart, for example. They consistently keep their turnover ratio between 8 and 11—a testament to incredible efficiency. Their secret isn’t magic; it’s a deep, data-driven understanding of what sells and a finely tuned supply chain. You can check out Walmart’s inventory performance on Statista.
Making these small, consistent tweaks to how you buy and sell can lead to huge wins. It’s all about making your inventory work for you, not the other way around. Honestly, this is one of the most powerful business growth strategies for small businesses you can implement. The focus should always be on turning those products back into cash as quickly and efficiently as possible.
Still Have Questions About Inventory Turnover Ratio Calculation?
Even after you’ve nailed the formula, some practical questions always seem to pop up. Let’s walk through a couple of the most frequent ones I hear from business owners.
How Often Should I Actually Run This Calculation?
For most small businesses, I’ve found that a quarterly calculation hits the sweet spot. It gives you a regular, predictable pulse on how efficiently you’re moving stock without bogging you down in constant number-crunching.
Of course, if you’re in a lightning-fast industry—think fresh food or fast fashion—you’ll want to do this monthly. Staying on top of trends in those spaces is everything, and a monthly check-in is crucial.
What If My Business Is Seasonal?
Ah, seasonality! This can really throw a wrench in the works if you’re not careful. If your sales have huge peaks and valleys, like a ski shop or a Christmas store, calculating your turnover ratio for specific, shorter timeframes is much more insightful.
Doing this lets you compare apples to apples—how did this year’s peak season perform against last year’s? A single annual number would just smooth everything out and hide the real story.
A Quick Note on a Related Metric: You’ll often hear about Days Sales of Inventory (DSI) alongside turnover. They’re two sides of the same coin. Your turnover ratio tells you how many times you sell through your inventory, while DSI tells you how many days it takes to do it.
At Business Like NZ Ltd, we’re all about helping you understand these numbers and use them to build real financial freedom. If you’d like an expert to look over your figures, get in touch with us for business advisory services.