
How to Hire Your First Employee: Essential Guide for Small Business
January 13, 2026
9 Proven Ways to Save Money in Business
January 28, 2026
Why Revenue Alone Won’t Tell You If Your Business Is Thriving
It’s a huge thrill to watch your revenue climb. Seeing those top-line numbers go up every quarter feels like you’ve finally made it. But here’s a hard truth many entrepreneurs learn too late: relying only on revenue to measure your company’s health is like judging a book by its cover. It gives you a piece of the story, but it’s often a misleading one.
I’ve seen it happen time and again. Founders celebrate amazing sales growth while completely missing the hidden problems slowly chipping away at their foundation. This is a classic example of focusing on a vanity metric—a number that looks impressive on a report but doesn’t actually reflect the real performance or health of the business.
Think about it. A business could easily double its revenue by tripling its marketing spend and slashing prices. The sales chart would look fantastic, but what about profitability? It would likely be in a nosedive. This is a textbook case of how to measure business success the wrong way. Without the full picture, high revenue can hide major issues like shrinking profit margins, sky-high customer acquisition costs, or a serious cash flow problem. I’ve known companies with millions in revenue that were suddenly struggling to make payroll because all their cash was tied up in inventory or waiting on client payments. They looked successful from the outside but were internally just a few weeks from closing their doors.
The Dangers of Top-Line Fixation
When your only focus is revenue, you miss the actual story of your business. It’s the difference between seeing the final score of a game and understanding the smart plays and strategies that led to the win. You start ignoring critical questions:
- How much did it cost to make that money? If your Gross Profit Margin is paper-thin, you’re just spinning your wheels, working harder for less actual profit.
- Are your customers happy and sticking around? High revenue could be fueled by one-off customers who have a bad experience and never return. That’s not a sustainable way to grow.
- Is your team engaged and productive? An overworked, burnt-out team might deliver a short-term revenue boost, but it will eventually lead to high turnover, lower quality work, and a toxic culture.
Shifting to a Holistic View
To truly get a pulse on your company’s vitality, you need to look at the bigger picture. The most successful leaders I know understand that long-term growth is about much more than just sales. It requires a balanced view of financial stability, customer happiness, and how well your internal operations are running.
Real success is measured by a combination of indicators that together paint a complete picture of business health. When you move beyond just revenue, you can spot the red flags early, make smarter strategic calls, and build a company that doesn’t just grow, but is built to last. This balanced approach is the real secret to learning how to measure business success in a way that truly matters.
Financial Health Indicators That Reveal The Real Story
Looking only at revenue gives you just one piece of the puzzle when you’re trying to figure out how to measure business success. The real story of your company’s health is hidden in the details—the profitability ratios and efficiency metrics that show how your business truly performs. These numbers tell a story about sustainability and can separate a business built for the long haul from one just chasing sales.
This infographic breaks down some of the core KPI targets that executives focus on to drive growth and operational efficiency.
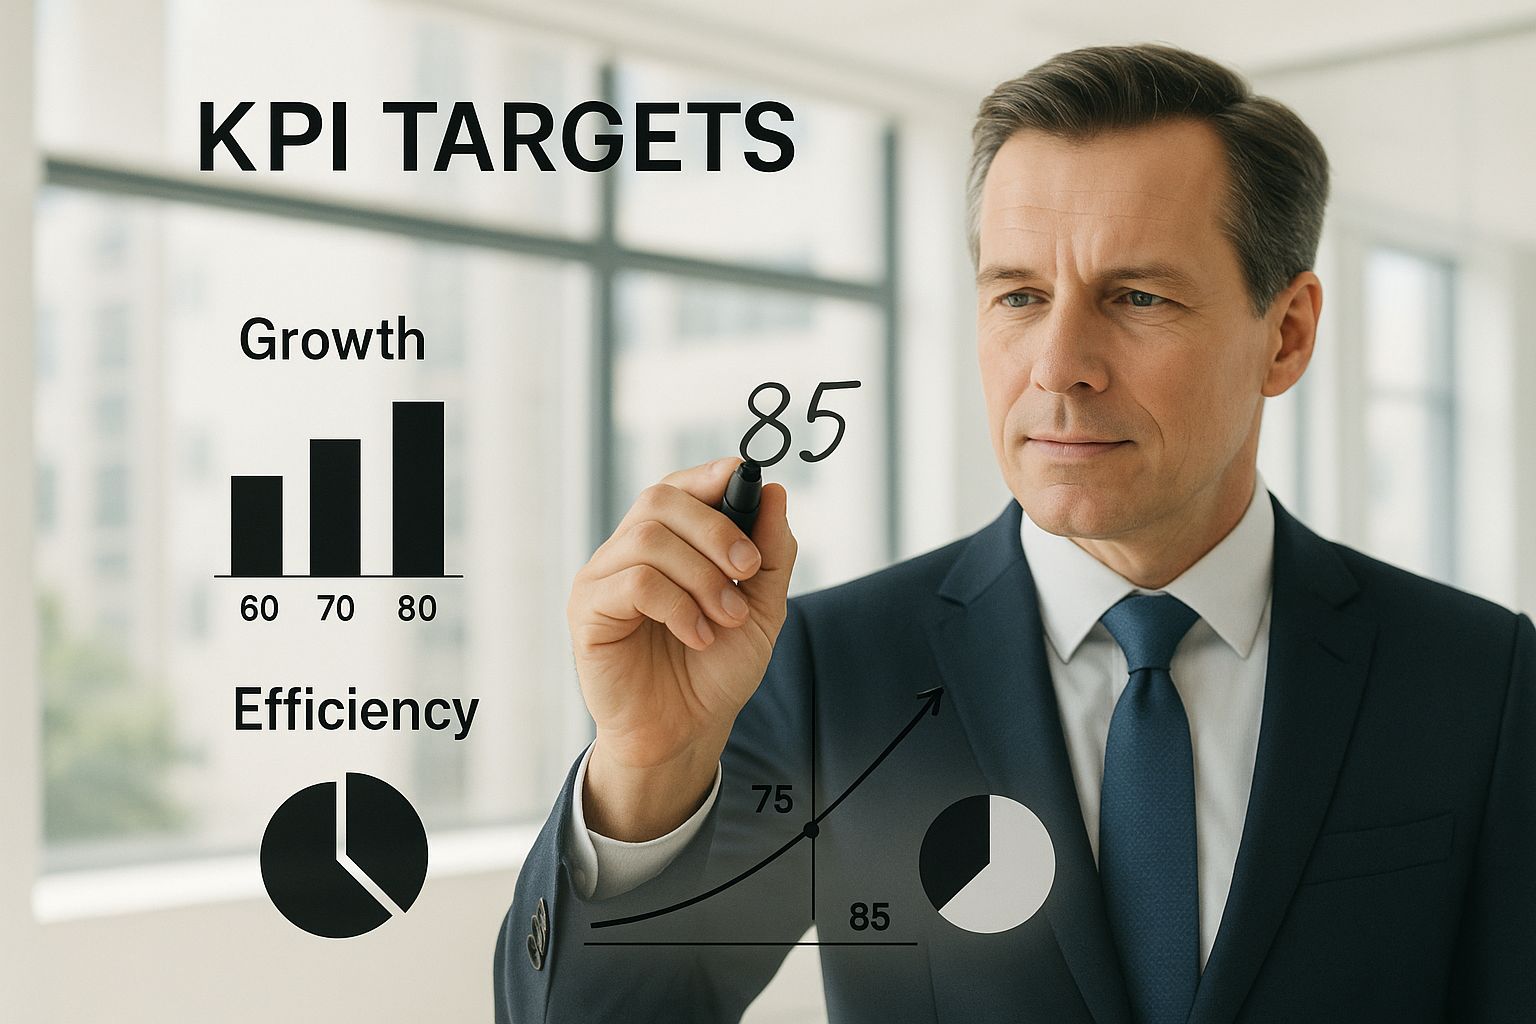
The big takeaway here is that successful leaders are always watching a balanced set of metrics, not just one, to steer their company in the right direction.
Key Profitability Ratios to Watch
Profitability isn’t just about having money left over at the end of the month; it’s about how well you generate that profit. The Gross Profit Margin is a fantastic place to start. It’s a classic way to measure business success because it shows how much profit you make on each dollar of sales before factoring in operating expenses.
You calculate it like this: (Net Sales – Cost of Goods Sold) / Net Sales, then express it as a percentage. A higher margin means better efficiency and profitability. According to recent financial KPI guides for 2025, businesses that keep a gross profit margin above 50% are generally in a strong position. Tech and software companies often shoot past this mark because their direct costs are lower. You can explore more about financial KPIs on NetSuite.com to see how your numbers stack up.
To give you a better sense of where you should be aiming, here’s a quick look at some key financial metrics and how they vary across different industries.
| Financial Metric | Calculation Method | Strong Performance | Industry Example |
|---|---|---|---|
| Gross Profit Margin | (Revenue – COGS) / Revenue | >50% | SaaS/Software: Often >80% due to low direct costs. |
| Net Profit Margin | (Net Income / Revenue) x 100 | >10% | Retail: Typically lower, around 2-5%, due to high overhead. |
| Current Ratio | Current Assets / Current Liabilities | >2.0 | Manufacturing: Needs a strong ratio to manage inventory and payables. |
| Cash Conversion Cycle (CCC) | DIO + DSO – DPO | <30 days | E-commerce: A short cycle is vital for managing cash flow with fast turnover. |
This table shows just how much “good” performance can depend on your specific industry. What’s excellent for a retailer might be a warning sign for a software company.
Beyond Profit: Assessing Operational Strength
While profit margins are crucial, they don’t paint the full picture. Two other critical areas to watch are cash flow and operational efficiency. The Cash Conversion Cycle (CCC) is a metric that many successful companies are obsessed with, and for good reason. It measures how long it takes for your company to turn its investments in inventory and other resources into actual cash from sales.
- A shorter CCC is a great sign. It means your cash isn’t tied up for long, which gives you more financial flexibility.
- A lengthening CCC can be a red flag. It might signal cash flow problems down the road, even if your sales numbers look great.
This ties directly into working capital management, which is all about how you handle short-term assets and liabilities. Beyond the numbers on your profit and loss statement, understanding how to measure operational efficiency can give you deeper insights into your business’s health. These metrics reveal if you have the operational backbone to support your growth, preventing you from expanding too quickly and running out of cash. Focusing on these indicators gives you a much clearer view of your company’s true stability and potential.
Customer Metrics That Predict Your Business Future
While your financial reports are great for showing where your business has been, customer metrics are your crystal ball—they show you where it’s going. It’s easy to get tunnel vision on sales targets and completely miss the signals your customers are sending about your company’s long-term health. Learning how to measure business success through their eyes gives you a predictive lens that financials just can’t provide.

These metrics tell you if your business is built on a solid foundation of loyalty or the shaky ground of one-time sales. This is where you graduate from simply counting transactions to understanding the true value of each customer relationship over its entire lifecycle.
The Power Duo: Retention and Lifetime Value
Two of the most telling customer-focused KPIs are Customer Retention Rate (CRR) and Customer Lifetime Value (CLV). CRR tells you the percentage of customers who stick around and keep buying from you over a set period. Think of it as a direct measure of loyalty and satisfaction.
CLV takes it a step further by projecting the total revenue you can reasonably expect from a single customer over the entire time they do business with you. A company with a high CLV has a predictable stream of future income, which makes it incredibly resilient. For example, a subscription software business with a high CLV can count on that recurring revenue to fund growth, even when new sales are slow. That’s a much more secure position than a business that’s constantly scrambling to replace lost customers.
The real magic happens when you see how these two metrics work together. Research has shown that improving customer retention by just 5% can boost profits by a staggering 25% to 95%. This huge impact comes from the simple fact that loyal customers not only spend more over time but are also cheaper to serve than new ones. You can discover more insights about these growth metrics at usewhale.io to see how they apply across different industries.
Listening to Your Customers: Satisfaction and Loyalty
Beyond CRR and CLV, you need a way to check the pulse of customer sentiment before it starts to affect your retention numbers. This is where satisfaction and loyalty metrics are essential.
- Net Promoter Score (NPS): This is a beautifully simple metric. You ask customers one question: “On a scale of 0-10, how likely are you to recommend our business to a friend or colleague?” It’s a fantastic gauge of overall brand loyalty and your potential for powerful word-of-mouth marketing.
- Customer Satisfaction Score (CSAT): CSAT is more transactional. You typically ask customers to rate their satisfaction with a specific interaction, like after a support call or right after they make a purchase. This helps you zero in on specific operational areas that need improvement.
Think of it this way: a high CSAT score on a support ticket shows your team handled a single problem well. But if your overall NPS score is low, it might point to a deeper issue with your product, pricing, or shipping that needs attention. Using both gives you a balanced view, allowing you to fix immediate fires while also building a brand that people genuinely want to support.
Making Data-Driven Decisions That Actually Drive Results
Your gut instincts have probably been a huge part of your business’s journey so far. But to keep growing, you need to combine that intuition with hard data. The leaders of top-performing companies aren’t just collecting information; they’re using it to make smarter, quicker decisions that build on each other over time. This is where understanding how to measure business success stops being a reporting chore and starts being a real strategic advantage.
The secret lies in bringing different data sources into one clear picture. Instead of checking sales figures in one system and customer reviews in another, smart businesses build dashboards that merge financial, operational, and customer metrics. This lets them spot connections they would otherwise miss. For instance, you might see that a small drop in a customer satisfaction score is an early warning for higher churn rates two months down the line, giving you a chance to step in and fix things.
Creating a Real-Time Performance Dashboard
A good dashboard is like your business’s command center. It shouldn’t flood you with every metric under the sun. Instead, it should show you the vital signs of your business at a single glance. Think about the information you absolutely need to make key decisions daily or weekly. For most small and medium-sized businesses, this usually includes:
- Cash Flow Projections: What does your cash balance look like for the next 30-60 days?
- Sales Pipeline Velocity: How fast are leads turning into actual, paying customers?
- Customer Retention Rate: What percentage of your customers are sticking around each month?
- Top and Bottom Performing Products/Services: Which offerings are truly boosting your profit, not just your revenue?
From Insight to Actionable Strategy
This move toward data-backed operations has fundamentally changed how leaders measure success. Real-time performance tracking is now a standard practice, not a luxury. In fact, studies show that organizations that rely on data insights are five times more likely to make better decisions than those that just go with their gut. Because of this, top executives now monitor a wide range of KPIs covering finances, operations, and market trends to stay quick on their feet. You can read more about the metrics CEOs are tracking to make better decisions.
To get the most out of their data, businesses often use advanced methods like scenario forecasting and financial planning. This helps them predict future outcomes and sidestep potential risks. It allows leaders to use their data not just to see what’s already happened, but to model what could happen. This helps with everything from allocating resources more effectively to confidently steering the company through uncertain market conditions.
Building Your Personal Success Measurement Framework
Your business isn’t a carbon copy of another, so why should your success metrics be? Using generic, one-size-fits-all measurements can easily send you down the wrong path, making you chase numbers that don’t actually move the needle for your company. The real key to figuring out how to measure business success is to build a custom framework that fits your unique industry, business model, and current stage of growth.
This isn’t about tracking every possible metric under the sun—that’s a quick recipe for getting overwhelmed. It’s about being smart and picking a handful of Key Performance Indicators (KPIs) that directly shape your daily decisions and long-term strategy.
Selecting Your Core KPIs
A great way to start is by sorting your metrics into two useful buckets: “Leading” and “Lagging” indicators. Understanding the difference is a game-changer.
- Lagging Indicators: These are the results of your past actions. Think of metrics like monthly recurring revenue (MRR) or customer churn rate. They’re crucial for seeing how you did, but you can’t directly change them in the heat of the moment. They’ve already happened.
- Leading Indicators: These are the proactive measures you take before the results come in. They are predictive. For instance, if your goal is to lower customer churn (a lagging indicator), a leading indicator could be your Customer Satisfaction Score (CSAT) or the number of proactive check-in calls your support team makes each week.
Putting your energy into leading indicators gives you levers to pull that can actually change the future. Imagine a local coffee shop owner. They might track daily foot traffic (a leading indicator) because they know it has a direct impact on their end-of-day sales (a lagging indicator). When you’re building your framework, it’s vital to clearly define what success looks like for different projects and how to monitor it. For example, you can learn a lot by measuring the success of automation initiatives using key metrics and KPIs.
Organizing Your Framework for Action
Once you have a list of potential KPIs, the next step is to organize them by business function. This gives you a balanced, big-picture view of your company’s health. A simple table is a fantastic tool to make this clear and actionable, helping you pick the right metrics for your specific business.
To help you get started, here’s a framework that shows how different business models might approach KPI selection.
Custom KPI Selection Framework by Business Type
Guide for selecting appropriate success metrics based on business model and industry
| Business Type | Primary KPIs | Secondary Metrics | Measurement Frequency |
|---|---|---|---|
| E-commerce Store | Conversion Rate, Average Order Value (AOV) | Cart Abandonment Rate, Customer Lifetime Value (CLV) | Daily / Weekly |
| SaaS Company | Monthly Recurring Revenue (MRR), Churn Rate | Customer Acquisition Cost (CAC), Net Promoter Score (NPS) | Monthly |
| Local Service Business | Number of Booked Appointments, Lead Conversion Rate | Cost Per Lead, Online Review Ratings | Weekly |
| Consultancy | Billable Hours, Project Profitability | Sales Pipeline Velocity, Client Satisfaction | Monthly |
This kind of structure moves you beyond just collecting data and into creating a system of accountability. Set realistic goals for each KPI and make sure specific team members are responsible for them. By checking in on these numbers regularly, you turn measurement from a boring report into an active tool that drives real, consistent improvement across your entire business.
Transforming Insights Into Profitable Business Actions
Having a solid set of KPIs is a great start, but it’s only half the job. A common trap for small businesses is figuring out what comes next—bridging the gap between knowing your numbers and knowing what to do with them. Just tracking metrics without acting on them is like owning a detailed map but never leaving your house. Real success happens when you turn those raw data points into smart, profitable business moves.
Smart entrepreneurs don’t just glance at metrics; they look for the story behind them. A dip in your Net Promoter Score (NPS) isn’t just a number—it’s a warning flare. A sudden spike in your website’s bounce rate for mobile users isn’t a random event; it’s an opportunity screaming for attention. The art of how to measure business success is about connecting these dots to spot threats before they grow or grab opportunities before your competitors do. For example, if you see your Customer Lifetime Value (CLV) is on the rise, that’s your signal to double down on whatever is making your loyal customers so happy.
This is a great example of a business dashboard that helps leaders see key analytics at a glance.
The real power here is seeing different data points—like sales trends, customer satisfaction, and website traffic—all in one place. It makes it much easier to spot connections and make informed decisions on the fly.
Communicating Insights to Inspire Action
Your team can’t act on insights they don’t understand or feel connected to. Data needs a narrative. Instead of just showing your sales team a chart with a declining conversion rate, pair that data with customer feedback that explains why it’s happening. Frame it not as a failure, but as a collective challenge. You could say, “Our conversion rate dropped by 5% last month, and customer surveys tell us the checkout process is a bit confusing. How can we simplify it this week to get those sales back?”
This approach turns a dry number into a shared mission. It gives your team context and a sense of ownership over the solution. This kind of communication is a key part of building effective business growth strategies for small businesses, as it gets everyone pulling in the same direction with a clear, data-driven goal.
From Data to Documented Improvement Plans
Once your team is fired up, you need a straightforward way to turn that energy into results. Don’t let great ideas fade away after a meeting. For every key insight, create a simple, clear action plan.
- Define the Goal: What specific metric are you aiming to improve? (e.g., “Increase average order value by 10%”).
- Assign Ownership: Who is taking the lead on this?
- Set a Deadline: When will you check in on progress and see the results?
- List Actionable Steps: What specific tasks need to get done? (e.g., “Add a ‘Frequently Bought Together’ section to our product pages”).
This structured process makes sure your measurement efforts lead to actual improvements, not just more reports. By consistently turning your data into focused actions, you create a powerful cycle of continuous improvement that drives real growth and changes the way you run your business.
At Business Like NZ, we specialize in helping small businesses in Auckland move beyond just tracking numbers to making strategic decisions that build real financial freedom. Contact us today to learn how we can help you turn your business data into your most valuable asset.


